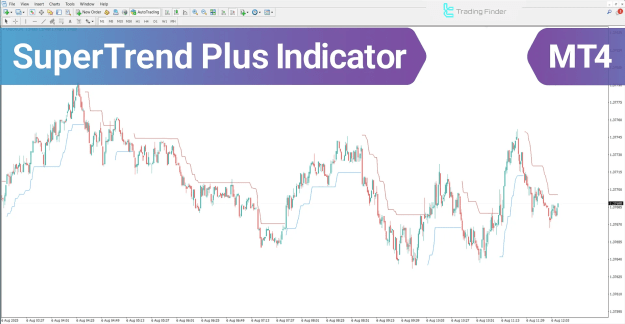
This indicator adjusts its position in real-time relative to price movement, offering a simultaneous visual representation of the prevailing trend direction and its potential reversal points.
https://cdn.tradingfinder.com/file/5...4-by-tflab.zip
https://www.metalsmine.com/thread/13...atrader-5-free
https://www.forexfactory.com/thread/...-in-metatrader
Prop Firm DrawDown Protector : Prop Firm Capital Protection Expert MT4 | Forex Money Management: Forex Trade Management Expert MT4 |ICT Concepts Indicator MT4 | Smart Money Concepts Expert MT4| Smart Money Trap Scanner | Get a free Expert Advisor license via Telegram and WhatsApp
Core Specifications and Trading Versatility
Designed for clarity and efficiency, this indicator is suitable for traders across various experience levels and markets.
Indicator Profile:
- Platform: MetaTrader 4 (MT4)
- Trading Skill Level: Elementary
- Primary Function: Trend Reversal Identification and Momentum Analysis
- Indicator Categories: Currency Strength, Trading Assistant, Momentum
- Timeframe Compatibility: Multi-Timeframe Analysis
Recommended Trading Style:
- Intraday Trading
Compatible Financial Instruments:
The SuperTrend Plus Indicator is a versatile tool applicable to:
- Forex currency pairs
- Cryptocurrency markets
- Stock Market indices and CFDs
Trading Logic and Visual Interpretation
The indicator's algorithm is based on dynamic price ranges and market volatility, typically utilizing the Average True Range (ATR) to draw a dynamic channel on the chart.
Definitive Trend Signals:
- Blue/Green Line (Uptrend Signal): When this line is dynamically plotted below the price candles, it signals the beginning or continuation of a bullish trend. This level acts as dynamic support.
- Red Line (Downtrend Signal): When this line appears above the price candles, it indicates the start or persistence of a bearish trend, acting as dynamic resistance.
A critical aspect of the indicator is the color change of the line, which serves as an essential alert for a potential trend reversal or significant correction.
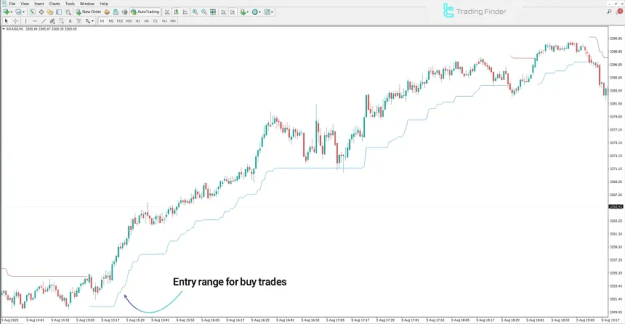
Executing Trades in a Bullish Trend
An analysis of the XAU/USD (Gold) chart on a 1-minute timeframe demonstrates a buy setup:
- The appearance of the green line below the candles confirms a shift to a bullish market structure.
- The formation of high-volume bullish candles with short lower wicks near this dynamic support level indicates strong buying pressure and creates a high-probability entry zone for long positions.
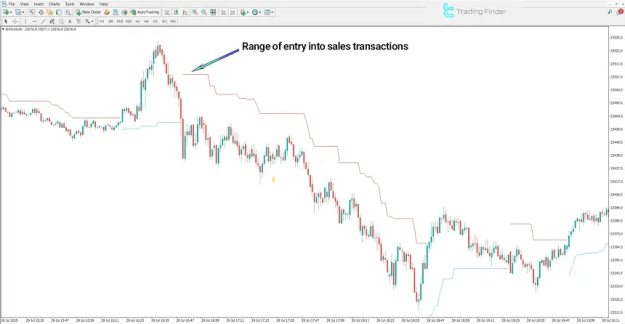
Identifying Opportunities in a Bearish Trend
A review of the NASDAQ 100 (NAS100) on a 1-minute chart illustrates a sell setup:
- The positioning of the red line above the candles confirms a active bearish phase.
- The development of strong bearish candles, particularly those with long upper wicks, at this dynamic resistance level confirms persistent selling pressure and establishes ideal conditions for short trade entries.
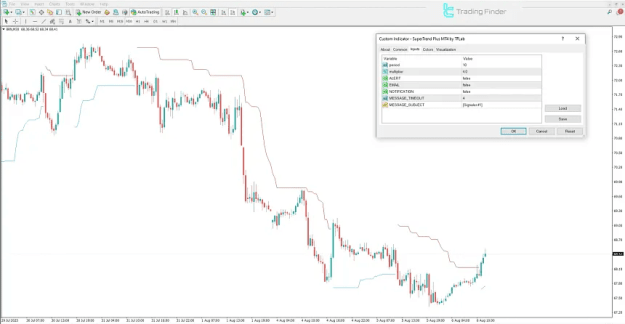
Customizable Parameters and Alert Settings
The SuperTrend Plus Indicator offers a practical settings panel for customization according to individual trading strategies and risk tolerance.
Key Configurable Parameters:
- PERIOD: Defines the number of candles used in the calculation cycle, affecting the indicator's sensitivity.
- MULTIPLIER: An amplification factor that adjusts the distance of the trend line from the price, allowing traders to customize for different asset volatilities.
- Comprehensive Alert System: Traders can activate multiple notification methods for trend changes, including:
- On-platform visual/text alerts (ALERT)
- Email notifications (EMAIL)
- Push notifications to mobile devices (NOTIFICATION)
- Message Customization: Settings for MESSAGE SUBJECT and MESSAGE TIMEOUT allow for personalized and managed alert delivery.
Conclusion
The SuperTrend Plus Indicator is a powerful and reliable tool for market trend analysis. By providing clear, dynamic levels of support and resistance, it delivers precise signals for both entry and exit points, effectively filtering out market noise.
The visual system is straightforward:
- Bullish setups are confirmed by the green line positioned below the price.
- Bearish setups are identified by the red line located above the candles.
This clarity makes the SuperTrend Plus an indispensable tool for traders seeking to capitalize on trend movements with well-defined risk parameters.