https://cdn.tradingfinder.com/file/5...5-by-tflab.zip
https://www.metalsmine.com/thread/13...accurate-trend
https://www.forexfactory.com/thread/...-in-metatrader
Prop Firm DrawDown Protector : Prop Firm Capital Protection Expert MT5 |Forex Money Management: Forex Trade Management Expert MT5 | ICT Concepts Indicator MT5 |Smart Money Concepts Expert MT5 | Smart Money Trap Scanner | Get a free Expert Advisor license via Telegram and WhatsApp
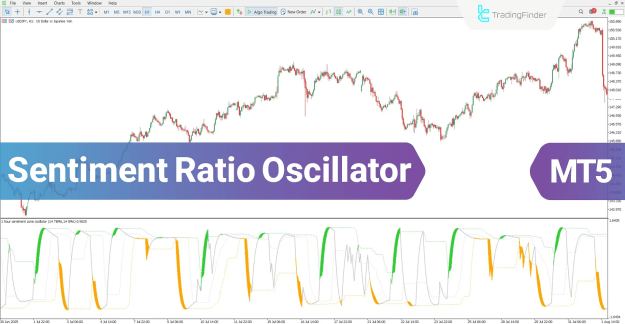
Core Specifications and Trading Application
This indicator serves as a multi-functional tool for traders seeking to capitalize on market reversals and sentiment shifts.
Indicator Profile:
- Platform: MetaTrader 5 (MT5)
- Core Function: Reversal Identification and Sentiment Analysis
- Trading Skill Level: Intermediate
- Indicator Categories: Oscillator, Signal & Forecast, Volatility
- Timeframe Compatibility: Multi-Timeframe Analysis
Ideal Trading Styles:
- Swing Trading
- Scalping
- Day Trading
Versatile Market Application:
The Sentiment Ratio Oscillator generates actionable signals across major asset classes, including:
- Forex currency pairs
- Cryptocurrency markets (e.g., Bitcoin)
- Stock CFDs and indices
Trading Logic and Signal Generation
The primary function of this oscillator is to identify exhaustion points in market trends by detecting extreme sentiment levels.
Core Trading Strategy:
- When the oscillator curve reaches overbought or oversold zones, it signals a high probability of an impending price reversal.
- These extreme zones act as an alert, while the subsequent crossover of the indicator lines provides a confirmed entry signal for trades.
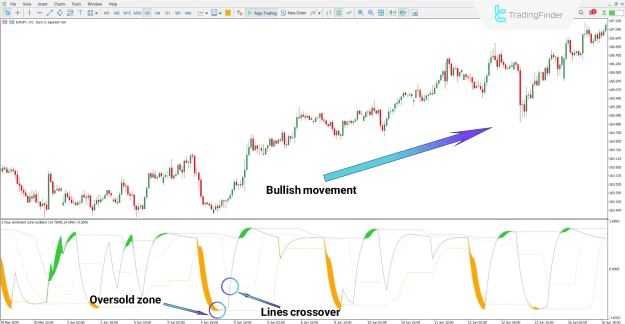
Executing a Buy Trade
An analysis of the USD/JPY chart on a 1-hour timeframe demonstrates a classic buy setup:
- The oscillator curve moves into the defined oversold zone, indicating a potential exhaustion of selling pressure.
- A confirmed buy signal is generated when the main oscillator curve crosses upward through its grey signal line, marking the optimal entry point for a long position.
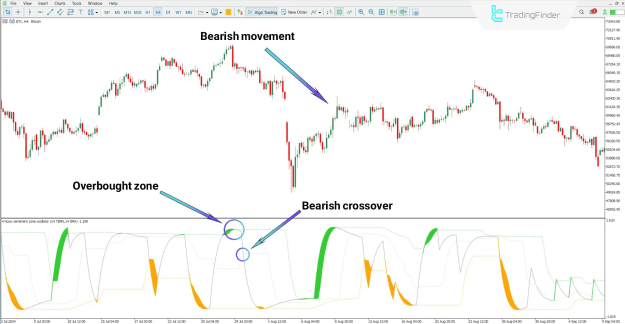
Executing a Sell Trade
Conversely, a sell setup is identified on a Bitcoin (BTC) chart:
- The oscillator enters the overbought zone, suggesting that buying momentum may be overextended.
- A sell signal is triggered by a downward crossover of the oscillator curve through its signal line, providing a strategic entry for a short trade.
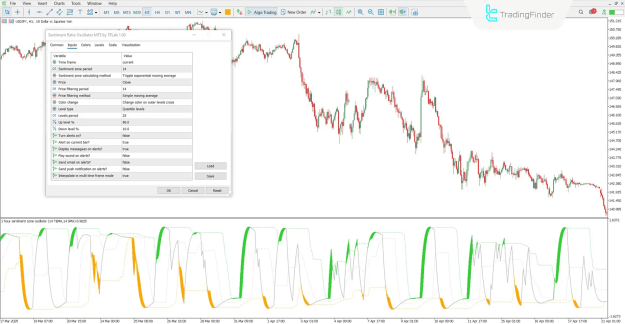
Advanced Customization and Alert Settings
The Sentiment Ratio Oscillator offers extensive customization to fine-tune its signals to your specific trading strategy.
Key Configuration Parameters:
Calculation and Zone Settings:
- Time Frame & Sentiment Zone Period: Defines the active chart and the lookback period for sentiment analysis.
- Price Filtering: Applies a moving average (e.g., SMA) to smooth price data for cleaner signals.
- Levels Configuration: Allows precise adjustment of the Up Level % and Down Level % to set custom overbought and oversold thresholds.
Visual and Alert Features:
- Color Change: The indicator line can be programmed to change color upon crossing key levels for immediate visual recognition.
- Comprehensive Alert System: Traders can activate multiple notification methods for signals, including:
- On-screen messages and sound alerts
- Email notifications
- Push notifications to mobile devices
Conclusion
The Sentiment Ratio Oscillator provides a systematic, data-driven approach to identifying market turning points. Its methodology, which combines moving averages with percentage-based levels, effectively highlights overbought and oversold zones where reversals are most likely.
Ultimately, the crossover event between the main oscillator curve and its signal line serves as the critical trigger, offering traders a disciplined and clearly defined mechanism for entering high-probability trades aligned with shifts in underlying market sentiment.