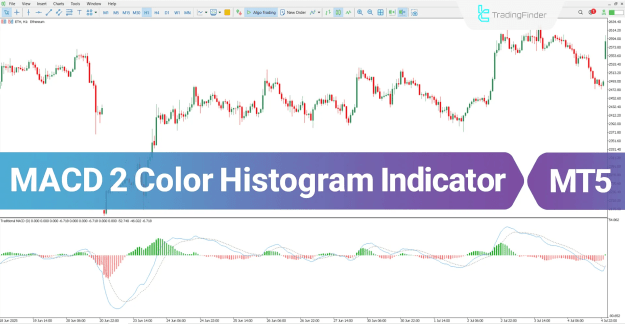
Green bars reflect increasing bullish power, while red bars signal weakening upward pressure or strengthening bearish momentum. This simple visual cue helps traders act on market reversals or continuations more confidently.
 You can download it from this link:
https://cdn.tradingfinder.com/file/5...5-by-tflab.zip
 You can also access the MetaTrader 4 version of this Indicator through this page:
https://www.metalsmine.com/thread/13...ator-mt4-tflab
 For instructions on how to install:
https://www.forexfactory.com/thread/...-in-metatrader
Prop Firm DrawDown Protector : Prop Firm Capital Protection Expert MT5 |Forex Money Management: Forex Trade Management Expert MT5 | ICT Concepts Indicator MT5 |Smart Money Concepts Expert MT5 | Smart Money Trap Scanner | Get a free Expert Advisor license via Telegram and WhatsApp
About the MACD 2 Color Histogram Oscillator
This indicator is part of several key MetaTrader 5 categories, including:
- Oscillators MT5 Indicators
- Signal & Forecast MT5 Indicators
- Currency Strength MT5 Indicators
It is available for MetaTrader 5 and supports multiple trading styles and instruments:
- Skill Level: Beginner to Intermediate
- Indicator Type: Reversal / Momentum Oscillator
- Timeframe: Multi-Timeframe Support
- Trading Style: Swing, Scalping, Day Trading
- Markets: Forex, Crypto, and Stocks
How the MACD 2 Color Histogram Generates Signals
The indicator operates based on the relationship between the MACD line and the Signal line.
- When the MACD line crosses above the signal line, a buy opportunity is indicated.
- When it crosses below, it suggests bearish momentum and a possible sell setup.
The histogram color dynamically changes with momentum strength, giving traders a quick visual confirmation of trend bias.
Buy Setup Example
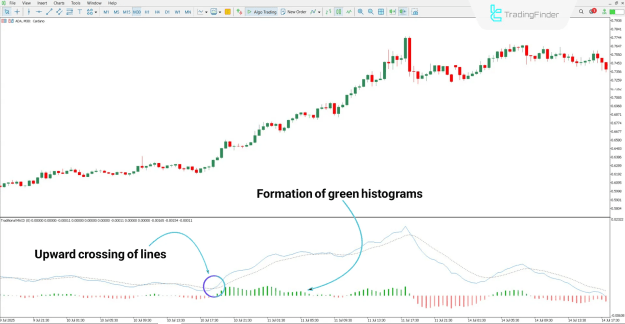
On a 30-minute Cardano (ADA) chart, when the MACD line rises above the signal line, a bullish entry signal forms.
As green histograms expand, they confirm strengthening upside momentum and support trend continuation.
Sell Setup Example
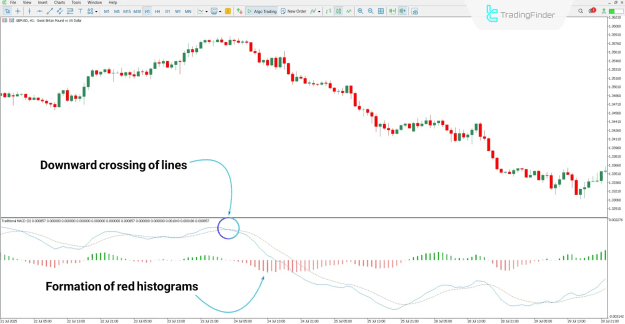
On a 1-hour GBP/USD chart, a bearish crossover between the MACD and signal line provides a sell signal.
The appearance of red histograms reflects growing selling pressure and sustained downside momentum.
Indicator Settings
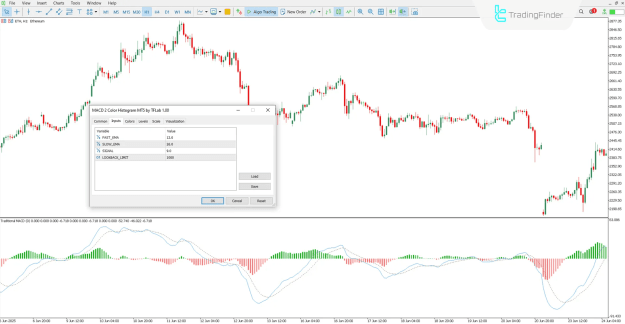
The MACD 2 Color Histogram is fully customizable, allowing traders to align its parameters with their strategy:
- FAST_EMA: Defines the short-term moving average
- SLOW_EMA: Defines the long-term moving average
- SIGNAL: Determines the smoothing period of the signal line
- LOOKBACK_LIMIT: Sets the visual and calculation range for display
These settings ensure flexibility across different instruments and timeframes.
Conclusion
The MACD 2 Color Histogram Indicator enhances traditional MACD functionality by using color-coded histograms to represent momentum changes clearly.
It helps traders quickly identify bullish or bearish momentum, improving timing for entries and exits.
With adaptable parameters, cross-market compatibility, and multi-timeframe precision, this indicator is a powerful addition for traders seeking objective momentum confirmation and clean visual cues within their MetaTrader 5 environment.