https://cdn.tradingfinder.com/file/5...4-by-tflab.zip
https://www.metalsmine.com/thread/13...dicator-on-mt5
https://www.forexfactory.com/thread/...-in-metatrader
Prop Firm DrawDown Protector : Prop Firm Capital Protection Expert MT4 | Forex Money Management: Forex Trade Management Expert MT4 |ICT Concepts Indicator MT4 | Smart Money Concepts Expert MT4| Smart Money Trap Scanner | Get a free Expert Advisor license via Telegram and WhatsApp
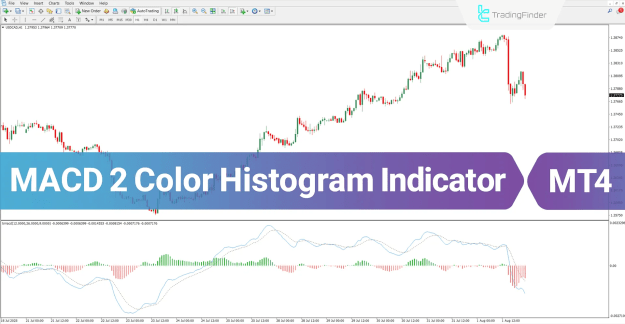
Understanding the MACD 2 Color Histogram
This indicator visually represents market momentum using a two-color histogram:
- Green Histograms: Signify strong bullish momentum, suggesting an upward price movement.
- Red Histograms: Indicate intense bearish momentum, suggesting a downward price movement.
Key Trading Signals and Entry Points
The primary mechanism for generating trading signals involves the interaction between the MACD line and the signal line:
- Buy Opportunity (Upward Crossover): A buy signal is generated when the MACD line crosses above the signal line. This is a critical indicator of a potential upward swing.
- Sell Opportunity (Downward Crossover): A sell signal is identified when the MACD line crosses below the signal line. This alerts traders to a possible downward trend reversal or continuation.
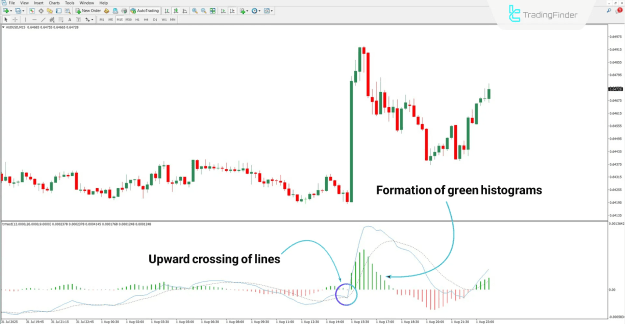
Identifying Buy Trades
An effective buy trade strategy combines the crossover with the histogram color:
- The upward crossover of the MACD line over the signal line marks a suitable entry point.
- The subsequent formation of green histograms provides strong confirmation of the bullish trend strength, further validating the long position.
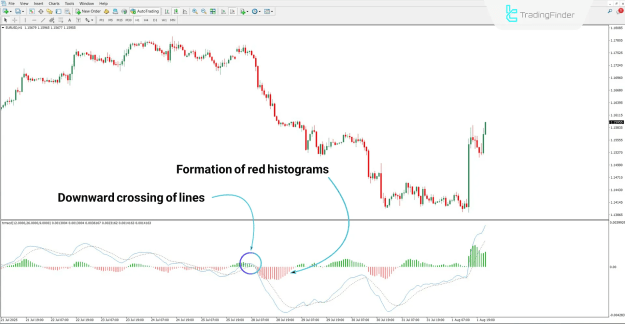
Identifying Sell Trades
A robust sell trade strategy focuses on the downward signal:
- The downward crossover of the MACD line below the signal line serves as the primary sell entry signal.
- The continuous and consecutive formation of red histograms reinforces the indication that the bearish trend is likely to persist, supporting a short position.
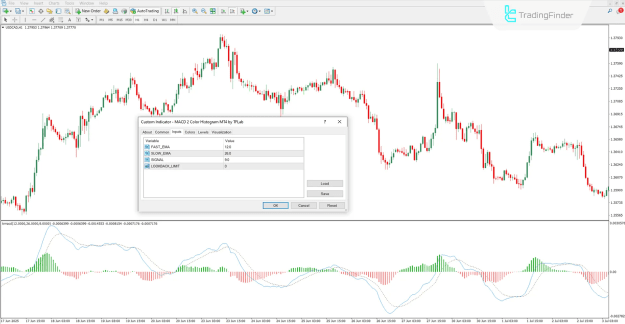
MACD 2 Color Histogram Indicator Settings
The MACD 2 Color Histogram oscillator offers adjustable parameters, allowing advanced customization to fit specific trading strategies:
- FAST_EMA: Governs the calculation of the Fast Exponential Moving Average.
- SLOW_EMA: Controls the calculation of the Slow Exponential Moving Average.
- SIGNAL: Determines the settings for the Signal Line Exponential Moving Average.
- LOOKBACK_LIMIT: Used to limit the data range for indicator display or calculation purposes.
Conclusion
The MACD 2 Color Histogram oscillator is a versatile technical analysis tool that provides dual insights:
- Momentum Assessment: The change in histogram color instantly communicates the strength and direction (bullish or bearish) of the underlying trend momentum.
- Entry Point Precision: The crossover of the MACD and signal lines reliably highlights precise entry points for both buy and sell trades.
Furthermore, its customizable moving average calculations (fast, slow, and signal) in the settings section empower users to fine-tune the indicator's sensitivity according to market conditions and personal trading style.