By applying meticulous time-based and structural analysis, the indicator effectively identifies divergence between correlated assets across the four quarterly timeframes (Q1–Q4).
https://cdn.tradingfinder.com/file/4...4-by-tflab.zip
https://www.metalsmine.com/thread/13...r-metatrader-5
https://www.forexfactory.com/thread/...-in-metatrader
Prop Firm DrawDown Protector : Prop Firm Capital Protection Expert MT4 | Forex Money Management: Forex Trade Management Expert MT4 |ICT Concepts Indicator MT4 | Smart Money Concepts Expert MT4| Smart Money Trap Scanner | Get a free Expert Advisor license via Telegram and WhatsApp
Core Functionality and Concept
The SSMT 4 Quarter Divergence Indicator functions by examining the relationship between two correlated assets, such as NQ100 and US400.
This correlation is fundamental for generating precise divergence signals and identifying potential market reversal points with accuracy.
Key Specifications of the SSMT 4 Quarter Divergence Indicator
- Indicator Categories: ICT Indicators, Smart Money Indicators, Trading Assist Indicators
- Platform Compatibility: MetaTrader 4 (MT4)
- Recommended Skill Level: Advanced Traders
- Indicator Type: Reversal Indicator
- Timeframe Coverage: Multi-Timeframe
- Trading Style: Intraday Trading
- Applicable Markets: Stocks, Forex, and Cryptocurrencies
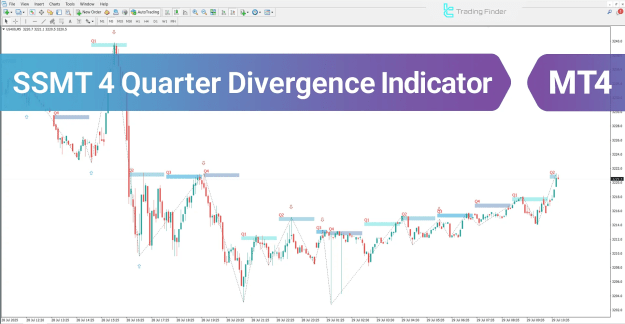
Overview of the SSMT 4 Quarter Divergence Indicator
The SSMT 4 Quarter Divergence Indicator detects phase-shift zones by identifying structural divergence between correlated assets and aligning those movements with market time cycles.
When divergence appears during quarterly transitions, the likelihood of smart money entry and trend reversal significantly increases.
Final confirmation is achieved through pivot point formation and market structure breaks on lower timeframes, allowing for precise entry points in premium or discount zones.
Signal Representation:
 Blue arrows: Indicate bullish divergence (buy signals)
 Red arrows: Indicate bearish divergence (sell signals)
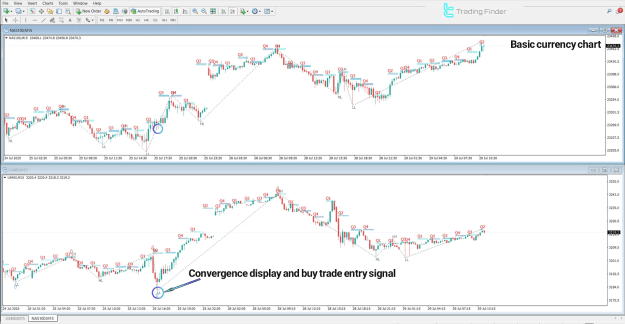
SSMT 4 Quarter Divergence in a Bullish Trend
In a bullish scenario, the SSMT Indicator detects time divergence between the NAS100 and US400 on the 5-minute timeframe.
- The US400 breaks the previous swing low, while the NAS100 remains structurally stable.
- This inconsistency indicates smart money absorption of selling pressure.
- Once confirmed by a bullish candlestick and a structure break in lower timeframes, an optimal buy opportunity emerges, represented by a blue arrow.
Bullish Trend Insight
This setup highlights the early phase of a bullish market cycle, reflecting institutional accumulation and offering strategic long-entry opportunities aligned with smart money behavior.
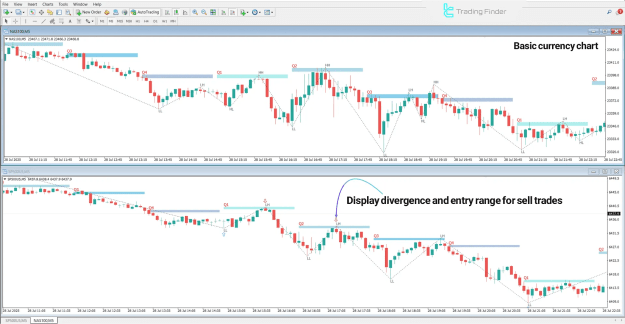
SSMT 4 Quarter Divergence in a Bearish Trend
In a bearish setup, divergence arises between the Nasdaq 100 and the S&P 500 when:
- The S&P 500 surpasses the previous quarter’s swing high,
- While the Nasdaq 100 fails to confirm the same movement.
This scenario suggests weakening buying momentum and smart money distribution.
When a bearish structure break is confirmed by a strong downward candlestick, a high-probability short signal is generated and marked by a red arrow.
Bearish Trend Insight
This phase signifies the exit of institutional capital and the onset of a downward trend, helping traders identify high-confidence short setups with minimal risk exposure.
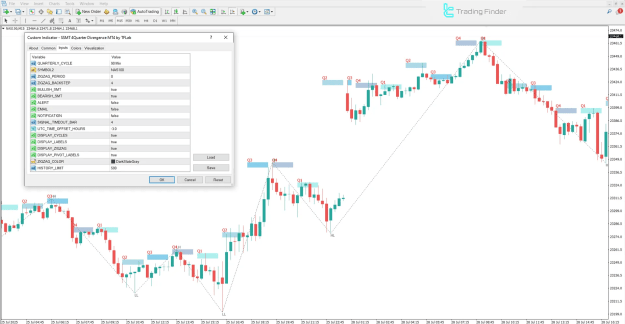
SSMT 4 Quarter Divergence Settings Overview
The SSMT Indicator includes a comprehensive settings panel that allows traders to customize its analytical behavior for greater precision and flexibility.
Available Parameters Include:
- QUARTERLY CYCLE: Defines the type of quarterly time division
- SYMBOL2: Specifies the second correlated asset
- ZIGZAG PERIOD: Adjusts zigzag sensitivity for trend recognition
- ZIGZAG BACKSTEP: Determines the number of candles required to confirm a pivot
- BULLISH SMT / BEARISH SMT: Activates bullish or bearish divergence detection
- ALERT / EMAIL / NOTIFICATION: Configures alerts and notification preferences
- SIGNAL TIMEOUT BAR: Sets the active duration of each signal
- UTC TIME OFFSET HOURS: Synchronizes alert timing with the user’s local time
- DISPLAY CYCLES / LABELS / ZIGZAG: Toggles on-screen visual elements
- DISPLAY PIVOT LABELS: Displays pivot-related identifiers
- ZIGZAG COLOR: Customizes zigzag line colors for better visibility
- HISTORY LIMIT: Sets the number of historical candles analyzed
These flexible settings enhance both the visual clarity and operational responsiveness of the SSMT divergence system.
Related Trading Tools You May Like
- Crypto Fear & Greed Index Tool – Market Sentiment Analysis
- Currency Converter – Convert 24 Fiat Currencies Instantly
- TradingFinder Fibonacci Calculator Tool 2025
- TradingFinder Margin Calculator Tool 2025 – Leverage up to 1:1000
Conclusion
In the SSMT 4 Quarter Divergence system, a quarter refers to dividing a selected trading period (such as a day or a week) into four equal market phases to analyze price behavior across sequential cycles.
By aligning these divisions with divergence between correlated assets, traders can accurately identify institutional phase transitions and smart money activity.
Because quarterly transitions frequently coincide with smart money entries or exits, the SSMT 4 Quarter Divergence Indicator offers a strategic advantage in spotting trend reversals and continuations with a refined level of accuracy and reduced trading risk.