These zones tend to attract strong price reactions because both retail traders and large financial institutions frequently place take-profit and stop-loss orders around them.
By plotting these areas as major and minor levels, the indicator helps traders clearly visualize where the market is likely to pause, reverse, or continue.
https://cdn.tradingfinder.com/file/4...5-by-tflab.zip
https://www.metalsmine.com/thread/13...tatarder-4-mt4
https://www.forexfactory.com/thread/...-in-metatrader
Prop Firm DrawDown Protector : Prop Firm Capital Protection Expert MT5 |Forex Money Management: Forex Trade Management Expert MT5 | ICT Concepts Indicator MT5 |Smart Money Concepts Expert MT5 | Smart Money Trap Scanner | Get a free Expert Advisor license via Telegram and WhatsApp
Indicator Specifications
Categories:
- Support & Resistance MT5 Indicators
- Trading Assist MT5 Indicators
- Levels MT5 Indicators
Platform: MetaTrader 5
Skill Level: Beginner to Intermediate
Indicator Type: Breakout & Reversal
Timeframe: Multi-Timeframe Compatible
Trading Styles: Swing, Scalping, and Day Trading
Assets Supported: Forex, Crypto, and Stocks
How It Works
When price approaches these psychological levels, the probability of a market reaction increases.
Using price action confirmation near these levels helps traders predict short-term movements and make more accurate entry and exit decisions.
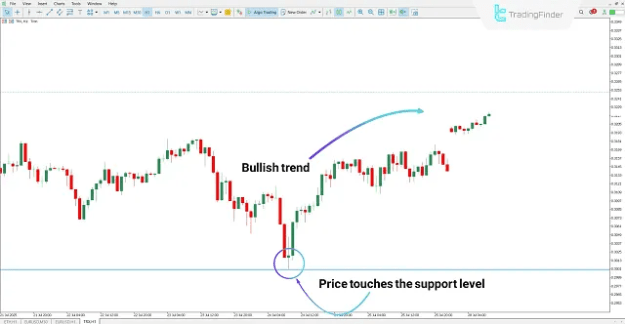
Bullish Example
On the 1-hour TRON (TRX) chart, price rises after touching a Sweet Spot level.
Here, the blue line acts as a support zone, offering a strong setup for a buy opportunity.
This example shows how the Sweet Spots Indicator can identify bullish reversal areas.
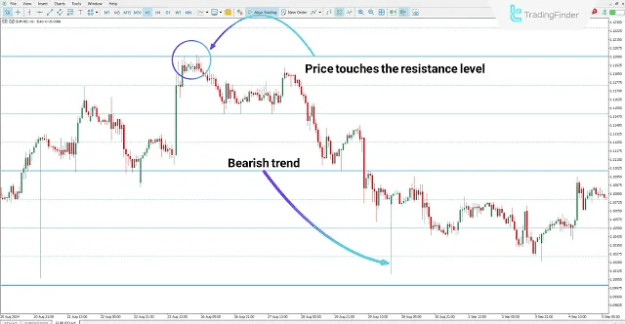
Bearish Example
In the EUR/USD chart, the blue line represents a resistance level.
After testing this zone, price begins to decline — a clear sign for traders to consider short positions.
Sweet Spots levels can easily be integrated with any trading strategy to refine sell entries and manage risk.
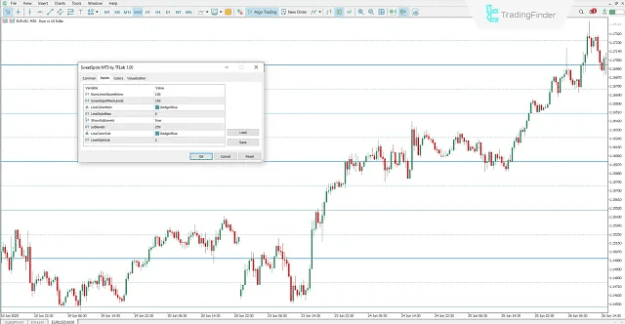
Indicator Settings
The Sweet Spots Indicator includes several adjustable parameters:
- NumLinesAboveBelow: Number of lines shown above and below the current price
- SweetSpotMainLevels: Distance between main price levels
- LineColorMain / LineStyleMain: Color and style of main level lines
- ShowSubLevels: Option to show or hide sub-levels
- Sublevels: Distance between sub-levels
- LineColorSub / LineStyleSub: Color and style of sub-level lines
Recommended Tools
- TradingFinder Forex Rebate Calculator – Cashback on 50+ currency pairs
- Forex Economic Calendar – Events from over 150 countries
- Crypto Market Watch (Telegram) – Track 16,000+ cryptocurrencies
- Pip Value Calculator – Quick pip calculations for 70+ instruments
Conclusion
The Sweet Spots Indicator for MT5 automatically highlights key price levels that often act as major support and resistance zones.
By analyzing price movement around these levels, traders can identify high-probability trading opportunities and improve their market timing.
Simple yet powerful, this indicator is a must-have for anyone looking to understand market behavior around psychological price points.