The levels generated by the indicator manifest as both major and minor zones on the chart, functioning as critical support and resistance areas.
https://cdn.tradingfinder.com/file/4...4-by-tflab.zip
https://www.metalsmine.com/thread/13...tatrader-5-mt5
https://www.forexfactory.com/thread/...-in-metatrader
Prop Firm DrawDown Protector : Prop Firm Capital Protection Expert MT4 | Forex Money Management: Forex Trade Management Expert MT4 |ICT Concepts Indicator MT4 | Smart Money Concepts Expert MT4| Smart Money Trap Scanner | Get a free Expert Advisor license via Telegram and WhatsApp
Sweet Spots Indicator Specifications and Functionality
Indicator Overview
The Sweet Spots indicator draws key psychological levels that frequently act as decisive price reaction points. This functionality is essential for traders looking to execute positions, as they can initiate buy or sell trades when the price interacts with these marked levels, typically confirming the entry using various price action strategies.
- Indicator Categories: Support & Resistance Indicators, Trading Assist Indicators, Levels Indicators.
- Platforms: MetaTrader 4 (MT4) Indicators.
- Trading Skills: Elementary.
- Indicator Types: Breakout Indicators, Reversal Indicators.
- Timeframe Compatibility: Multi-Timeframe Indicators.
- Trading Styles: Day Trading Indicators, Scalper Indicators, Swing Trading Indicators.
- Trading Instruments: Stock Market Indicators, Cryptocurrency Indicators, Forex Indicators.
Trading Conditions Utilizing the Sweet Spots Indicator
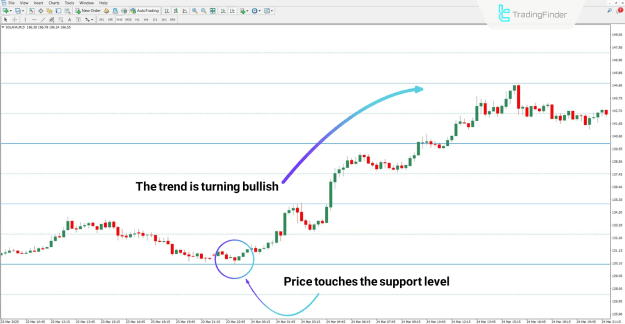
Bullish Trend Conditions
In an established or potential uptrend, the Sweet Spots indicator can highlight critical support.
- For instance, on a 15-minute timeframe chart, when the asset (like Solana (SOL)) touches a marked level, it may subsequently begin a sharp upward trajectory.
- The plotted blue line effectively serves as a support level, offering a premium entry opportunity for bullish traders. This interaction can signal a trend reversal or continuation after a pullback.
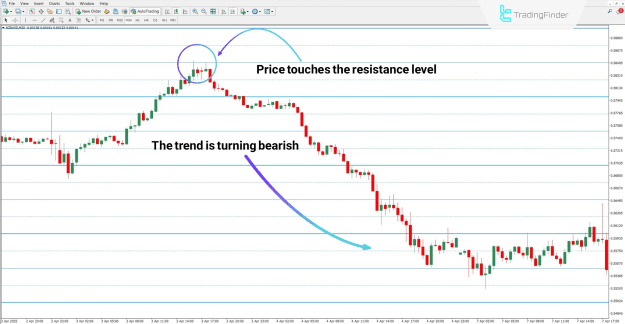
Bearish Trend Conditions
Conversely, the indicator is effective at identifying resistance in a downtrend or correction.
- Examining a 30-minute chart (e.g., the NZD/USD currency pair), the blue line can function as a strong resistance level. The price often declines immediately after making contact with this zone.
- Traders should look for confirmatory price action. The presence of a pin bar followed by a robust bearish candlestick at the resistance level can provide a strong warning signal for setting up sell trades.
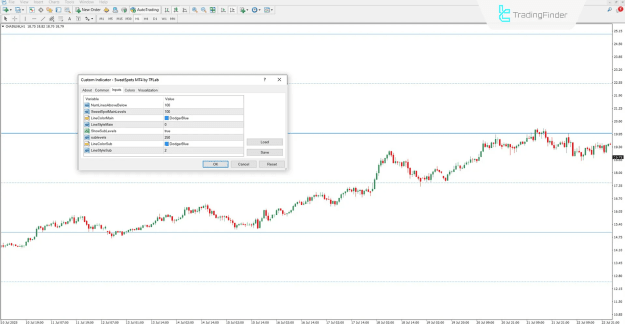
Sweet Spots Indicator Settings and Configuration
The user-friendly settings panel allows traders to customize the indicator based on their preference and the asset being traded.
- NumLinesAboveBelow: Configures the number of main psychological lines displayed both above and below the current market price.
- SweetSpotMainLevels: Defines the distance or interval between the primary, more significant price levels.
- LineColorMain & LineStyleMain: Allows customization of the visual representation (color and style) of the main level lines.
- ShowSubLevels: A toggle to enable or disable the display of secondary, less significant price levels.
- Sublevels: Sets the distance or interval between these minor, or sub-levels.
- LineColorSub & LineStyleSub: Allows customization of the visual representation (color and style) of the sub-level lines.
Conclusion
The Sweet Spots indicator is a frequently employed and highly valuable component of technical analysis. Its primary utility is the automatic demarcation of key price touch levels on any financial instrument's chart. Fundamentally, these marked levels represent critical support and resistance zones where the market price exhibits a high probability of reacting, making them indispensable for disciplined trading strategies.