https://cdn.tradingfinder.com/file/4...4-by-tflab.zip
https://www.metalsmine.com/thread/13...r-metatrader-5
https://www.forexfactory.com/thread/...-in-metatrader
Prop Firm DrawDown Protector : Prop Firm Capital Protection Expert MT4 | Forex Money Management: Forex Trade Management Expert MT4 |ICT Concepts Indicator MT4 | Smart Money Concepts Expert MT4| Smart Money Trap Scanner | Get a free Expert Advisor license via Telegram and WhatsApp
Core Concept of the Indicator
The fundamental premise of the Sibbet Demand Index Divergence Indicator is that a market trend is likely to reverse when the price action is not supported by corresponding strength in demand.
- Weak Demand in an Uptrend: When an asset's price is rising, but the indicator shows a weakening in underlying demand, it suggests seller exhaustion is likely to occur, increasing the probability of a bearish reversal.
- Rising Demand in a Downtrend: Conversely, when prices are falling, but the indicator signals an increase in hidden demand, it often forewarns of a potential upward Pivot Point reversal.
Key Features and Market Application
The Sibbet Demand Index Divergence Indicator is highly versatile and applicable across various trading scenarios and instruments.
- Indicator Categories: It falls under the umbrella of Oscillators, Momentum Indicators, and Reversal MT4 Indicators, primarily serving as a Trading Assist tool.
- Platform: It is specifically designed for use on the MetaTrader 4 Indicators platform.
- Timeframe and Style: It operates as a Multi-Timeframe MT4 Indicator and is optimized for the Intraday MT4 Indicators trading style.
- Applicable Instruments: The tool is effective for analyzing a wide range of markets, including Forex MT4 Indicators, Share Stocks MT4 Indicators, Indices Market MT4 Indicators, Commodity Market MT4 Indicators, Stock Market MT4 Indicators, and Cryptocurrency MT4 Indicators.
- Trading Skills: Its effective utilization is best suited for traders with an Intermediate skill level.
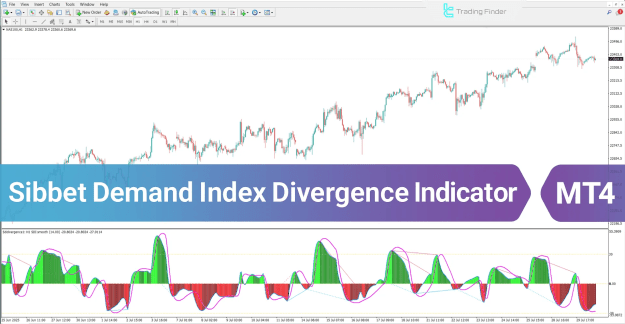
Sibbet Demand Index Divergence at a Glance
The indicator visually presents a mismatch between price action and market strength by drawing divergence lines between the asset's price chart and the demand index.
- It highlights changes in true market demand and buy/sell pressure through the use of color-coded histograms.
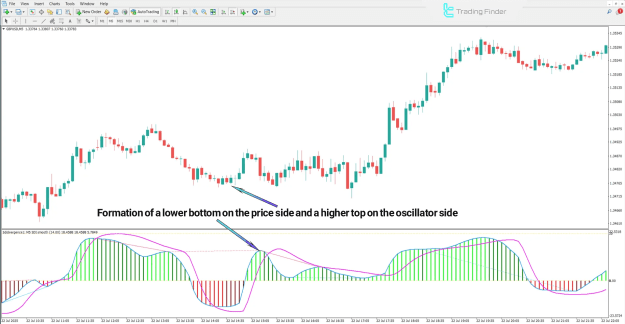
Indicator in Bullish Trend Analysis
A bullish divergence provides an early warning of a potential upward trend reversal.
- Definition of Bullish Divergence: This occurs when the asset's price makes a lower low while the demand indicator registers a higher low.
- Market Interpretation: This mismatch signifies a gradual increase in hidden buying pressure even as the price appears to be declining (bearish).
- Signal: It typically indicates the seller exhaustion phase is ending and buyer entry is increasing, signaling a likely upward trend reversal.
- Application Example: This pattern can be observed in currency pairs like the GBP/USD on a 5-minute timeframe.
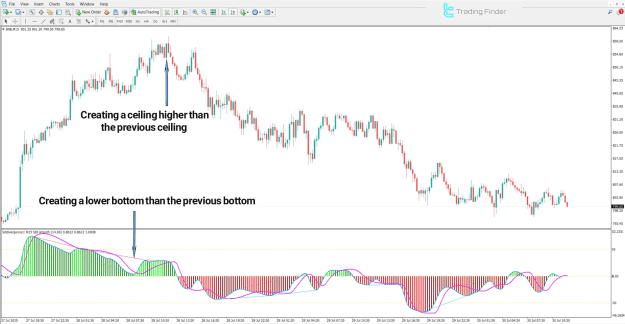
Indicator in Bearish Trend Analysis
A bearish divergence suggests declining demand, increasing the probability of a downward trend reversal.
- Definition of Bearish Divergence: This is identified when the price forms a higher high but the indicator forms a lower high.
- Market Interpretation: This pattern indicates a decline in demand and a weakening of buyers despite the rising price.
- Signal: It increases the likelihood of a bearish reversal.
- Confirmation: Traders often confirm the entry signal by looking for trendline breaks or bearish candlestick patterns.
- Application Example: This can be seen in indices such as the BNB cryptocurrency index on a 15-minute timeframe.
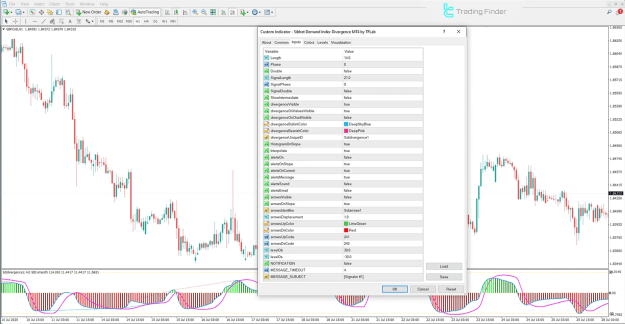
Customizing Sibbet Demand Index Divergence Settings
The MetaTrader 4 version of the Sibbet Demand Index Divergence Oscillator provides extensive customization options for traders. Key parameters for calculation, visual representation, and alerts include:
- Calculation Parameters:
- Length: Defines the calculation period for the index.
- Phase and Double: Control the signal phase and numerical precision.
- Signal Length, Signal Phase, and Signal Double: Apply the same controls specifically to the signal line.
- Divergence Visualization:
- Divergence Visible: Toggles the display of divergence lines.
- Divergence On Chart Visible: Controls the visual display of divergences directly on the price chart.
- Divergence Bullish Color and Divergence Bearish Color: Customize the visual appearance of each divergence type.
- Histogram and Data Display:
- Histogram on Slope: Allows the histogram display to be based on the slope of the index.
- Interpolate: Enables the interpolation of discrete data points.
- Alert and Notification Settings:
- Alerts On: Activates the indicator's alert system.
- Alerts On Slope and Alerts On Current: Specify when alerts are triggered (on a slope change or on the current candle).
- Options for various notification methods, including Alerts Message, Alerts Sound, and Alerts Email, are available.
- Arrow Configuration:
- Arrows Visible: Enables the display of directional arrows on the chart.
- Arrows Up Color and Arrows Dn Color: Customize the colors of the up and down arrows, which typically signify the reversal signals.
- Reference Levels:
- Level OB and Level OS: Set the reference points for Overbought and Oversold conditions.
Conclusion
The Sibbet Demand Index Divergence Indicator is an indispensable Trading tool for MetaTrader 4 traders aiming to identify crucial market turning points. It facilitates proactive trading decisions by:
- Bullish Divergence: Detecting rising demand during a price decline, indicating a likely upward reversal.
- Bearish Divergence: Highlighting declining demand during a price advance, signaling a likely reversal to the downside.
By comparing price action with true market demand strength, this indicator provides a significant edge in spotting potential trend reversals before they are visible on the main price chart.