https://cdn.tradingfinder.com/file/5...5-by-tflab.zip
https://www.metalsmine.com/thread/13...or-metatrader4
https://www.forexfactory.com/thread/...-in-metatrader
Prop Firm DrawDown Protector : Prop Firm Capital Protection Expert MT5 |Forex Money Management: Forex Trade Management Expert MT5 | ICT Concepts Indicator MT5 |Smart Money Concepts Expert MT5 | Smart Money Trap Scanner | Get a free Expert Advisor license via Telegram and WhatsApp
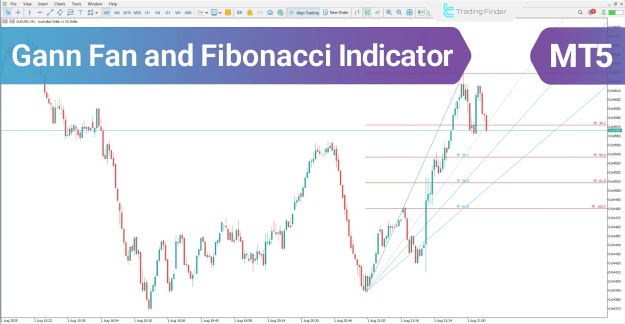
Gann Fan and Fibonacci at a Glance
Within the MetaTrader 5 platform, the Gann Fan and Fibonacci Indicator serves to identify critical support, resistance, and potential price reversal areas. It achieves this by integrating the time-price relationship of Gann angles with the horizontal levels of Fibonacci retracements.
- Gann Angles: These diagonal lines illustrate the intrinsic relationship between time and price movement.
- Fibonacci Levels: These horizontal lines highlight potential levels for price retracement or trend continuation.
When these two distinct analytical methods intersect within a specific chart area, they define a potent trade entry zone.
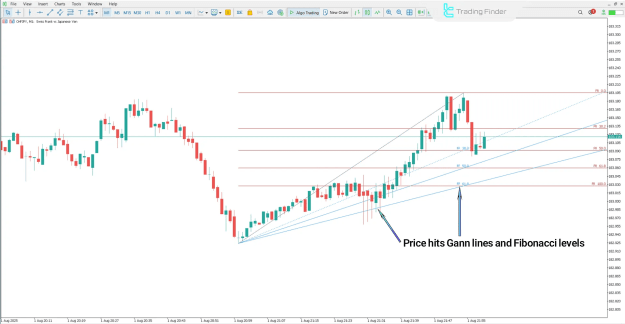
Identifying an Uptrend with the Indicator
The following analysis is based on the CHF/JPY currency pair on a 30-minute timeframe. During a defined uptrend, a buy signal is confirmed under a specific condition.
- Buy Signal Confirmation: The price must touch one of the ascending Gann support lines while simultaneously aligning with a significant Fibonacci retracement level.
- Zone Significance: This overlap highlights a high-probability area for a bullish price reversal.
- Trade Entry: A subsequent upward price reaction from this confluence zone can be considered a valid entry point for long positions.
Uptrend Conditions in the Gann Fan and Fibonacci Indicator
The chart visually demonstrates how the tool identifies key areas of support during an upward market movement. The synergy between the rising Gann line and a Fibonacci level creates a technical foundation for a potential continuation of the uptrend.
Buy Entry Zone in the Gann Fan and Fibonacci Indicator
This specific area on the chart marks the precise point where the buy signal is generated. Traders monitor this zone for bullish price action, such as a bounce or a candlestick reversal pattern, to time their entry.
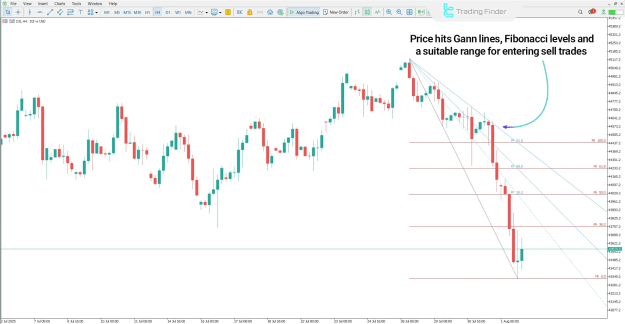
Identifying a Downtrend with the Indicator
This analysis applies to the Dow Jones Index (DJI) on a 4-hour timeframe. In a prevailing downtrend, the indicator generates sell signals through a distinct confluence.
- Sell Signal Confirmation: A sell signal emerges when the price tests a descending Gann resistance line and coincides with a key Fibonacci retracement level.
- Zone Significance: This intersection creates a high-tension area with an increased probability of a bearish price reversal.
- Trade Entry: A rejection from this zone, evidenced by new downward momentum, provides a valid entry signal for short positions.
Sell Zone in the Downtrend Using the Gann Fan and Fibonacci Indicator
The chart illustrates the formation of a resistance confluence. The Gann fan line acts as a dynamic ceiling, and its intersection with a Fibonacci level strengthens the case for a resumption of the downtrend.
Downtrend of the Gann Fan and Fibonacci Indicator in the MetaTrader 5 Platform
This visual example within the MT5 environment shows the practical application of the tool for identifying selling opportunities in a falling market, emphasizing its utility across different asset classes.
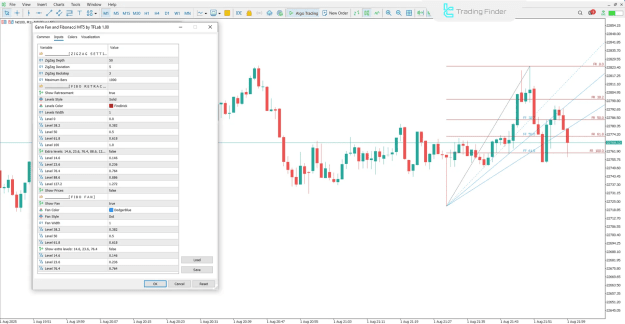
Configuring the Gann Fan and Fibonacci Indicator
The settings panel of the indicator in MetaTrader 5 allows for extensive customization to align with various trading strategies and instruments.
ZigZag Settings
The indicator utilizes a ZigZag pattern to identify significant highs and lows. Its parameters are crucial for accurate level drawing.
- ZigZag Depth: Controls the minimum price movement required to form a new ZigZag point.
- ZigZag Deviation: Defines the minimum price deviation in points to establish a new high or low.
- ZigZag Backstep: Sets the minimum number of bars between consecutive ZigZag highs and lows.
- Maximum Bars: Determines the number of historical bars the indicator analyzes.
Fibonacci Retracement Settings
This section manages the appearance and visibility of the horizontal Fibonacci levels.
- Show Retracement: Toggles the visibility of all Fibonacci retracement levels.
- Levels Style, Color, and Width: Controls the visual presentation of the retracement lines.
- Standard Levels: Key Fibonacci ratios such as Level 0, Level 38.2, Level 50, Level 61.8, and Level 100 are fundamental and typically enabled.
- Extra Levels: Additional ratios like 14.6%, 23.6%, 76.4%, 88.6%, and the 127.2% extension can be activated for deeper analysis.
- Show Prices: Displays the corresponding price value directly on each level for quick reference.
Fibonacci Fan Settings
This section controls the diagonal Fibonacci fan lines, which provide a different perspective on support and resistance.
- Show Fan: Toggles the visibility of the Fibonacci fan lines.
- Fan Color, Style, and Width: Defines the visual properties of the fan lines.
- Standard Fan Angles: The primary angles based on the 38.2%, 50%, and 61.8% ratios.
- Show Extra Levels: Activates additional fan angles derived from the 14.6%, 23.6%, and 76.4% ratios.
Conclusion
The Gann Fan and Fibonacci Indicator consolidates the power of Gann's geometric angles with Fibonacci's natural ratios into a single, powerful analytical tool. It is highly effective for identifying significant support and resistance levels, along with potential price reversal zones. By conducting a simultaneous analysis of time and price relationships, this indicator pinpoints market areas with a high probability of a technical reaction, providing traders with a structured framework for making informed trading decisions.