https://cdn.tradingfinder.com/file/4...4-by-tflab.zip
https://www.metalsmine.com/thread/13...etection-tflab
https://www.forexfactory.com/thread/...-in-metatrader
Prop Firm DrawDown Protector : Prop Firm Capital Protection Expert MT4 | Forex Money Management: Forex Trade Management Expert MT4 |ICT Concepts Indicator MT4 | Smart Money Concepts Expert MT4| Smart Money Trap Scanner | Get a free Expert Advisor license via Telegram and WhatsApp
Key Features and Components
This tool combines several technical components and advanced algorithms to create its dynamic visual display.
- Swing Point Detection: The indicator identifies supply and demand areas based on valid price reversals.
- Fibonacci Overlap: Zones are reinforced when they align with key Fibonacci levels, specifically the 50%, 61.8%, and 78.6% retracements on price swings.
- Price Action Analysis: The accuracy of zones is further evaluated through the analysis of candlestick reversal patterns, momentum, and price reactions.
- Advanced Algorithmic Filter: Weak or less reliable zones are automatically filtered out to enhance the precision of the indicator.
- Dynamic Visual Display: Zones are shown with varying color intensity and transparency, reflecting their validity and strength.
Trading with the DTFX Algo Zones Indicator
The indicator's colored zones provide clear visual cues for potential trade entries in both uptrend and downtrend scenarios.
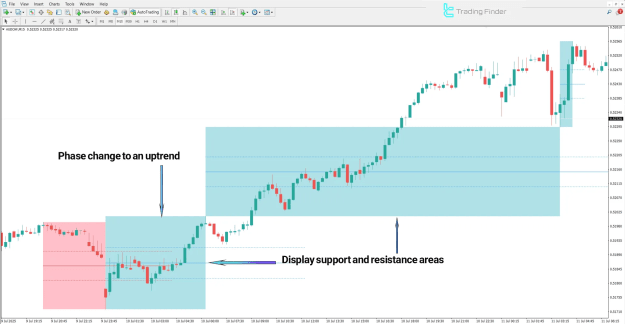
Trading in an Uptrend
When the market is in an uptrend, a trade entry can be considered when the price touches a DTFX demand zone (green zone). This opportunity is confirmed by bullish signals, such as bullish candlesticks or long lower shadows. The reliability of the entry is enhanced with additional confirmations like high trading volume or a breakout of a downtrend line.
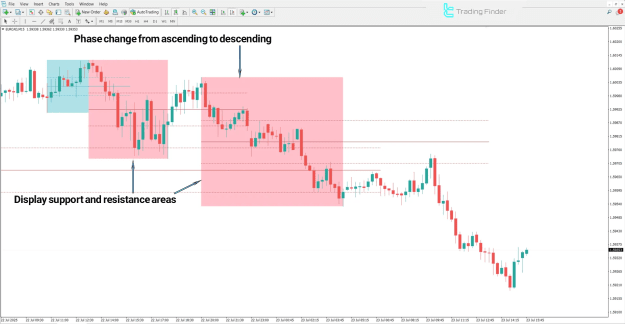
Trading in a Downtrend
In a downtrend, when the price enters a DTFX supply zone (red zone), it signals the activation of selling pressure and a potential trade opportunity. Bearish reversal patterns, such as engulfing candles or long upper shadows within the red zone, indicate a likely continuation of the decline. The zone's reliability for an ideal sell entry point is increased if this bearish reaction coincides with Fibonacci levels or a descending trendline.
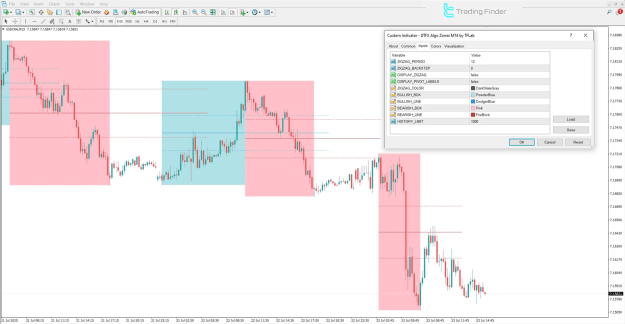
Indicator Settings
The DTFX Algo Zones Indicator offers customizable settings to suit individual trading preferences.
- Zigzag Period: Adjusts the sensitivity of the zigzag calculation.
- Zigzag Backstep: Defines the lookback period for the zigzag.
- Display Zigzag: Toggles the visibility of the zigzag line on the chart.
- Display Pivot Labels: Enables or disables labels for pivot points.
- Zigzag Color: Changes the color of the zigzag line.
- Bullish Box: Sets the color for demand zones.
- Bullish Line: Sets the color for bullish lines.
- Bearish Box: Sets the color for supply zones.
- Bearish Line: Sets the color for bearish lines.
- History Limit: Controls the amount of historical data displayed by the indicator.
Conclusion
The DTFX Algo Zones Indicator is an effective and powerful trading tool for detecting high-potential reversal zones based on a confluence of price action, Fibonacci retracements, and market structure analysis. With its precise visualization and smart algorithmic filters, the indicator effectively highlights key trading zones without cluttering the chart, making it an essential tool for intermediate traders on platforms like MetaTrader 4.