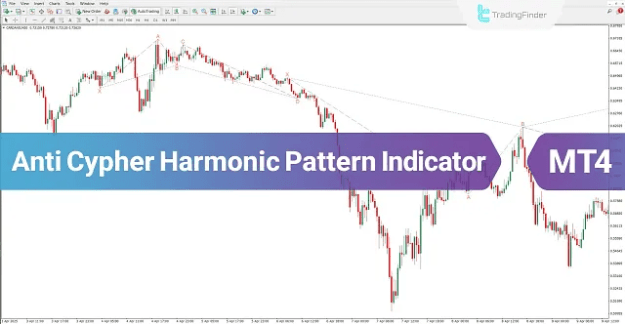
This indicator graphically plots these patterns directly on the trading chart, rendering bullish patterns in a distinct pink color and bearish patterns in a dark blue color for immediate visual recognition.
https://cdn.tradingfinder.com/file/3...4-by-tflab.zip
https://www.forexfactory.com/thread/...-in-metatrader
TP & SL Tool: Risk Reward Ratio Calculator RRR MT4 | Prop Firm Protector: Trade Assist Prop Firm Plus TF Expert MT4 | Money Management + DrawDown Protector: Trade Panel Prop Firm Drawdawn Limiter Pro MT4 |Get a free Expert Advisor license via Telegram and WhatsApp
Key Specifications of the Indicator
- Platform: MetaTrader 4 (MT4)
- Trading Skill Level: Intermediate
- Indicator Type: Reversal
- Applicable Timeframe: Multi-Timeframe
- Trading Style: Intraday
Supported Trading Instruments:
- Forex Pairs
- Cryptocurrencies
- Share Stocks
- Indices
- Commodities
Indicator Categories:
- Harmonic MT4 Indicators
- Reversal MT4 Indicators
- Chart & Classic MT4 Indicators
- Candle Sticks MT4 Indicators
The Core Function: Identifying False Breakouts
A pivotal feature of the Anti Cypher Harmonic Pattern Indicator is its specialized ability to detect fake breakouts and deceptive market movements. Conventional harmonic patterns often fail when confronted with these false, or "unreal," price breakouts. In contrast, the Anti Cypher indicator is specifically activated within these zones. It proficiently identifies high-probability contrarian opportunities that run counter to the prevailing market expectation, providing traders with a significant edge.
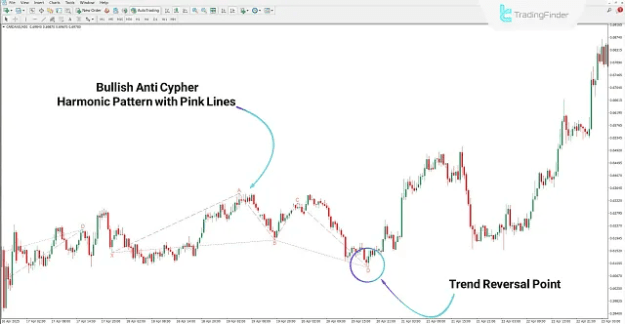
Bullish Market Application
Scenario Analysis on a Crypto Chart
A clear example can be observed on the 30-minute chart for Cardano (ADA). Following the complete formation of a bullish Anti Cypher pattern and upon the price successfully reaching the projected termination point "D", a robust upward trend commenced. This pronounced bullish momentum signifies the market's positive reaction to the identified reversal zone at point "D". It effectively confirms the validity and accuracy of the buy signal generated by the bullish Anti Cypher Harmonic Pattern.
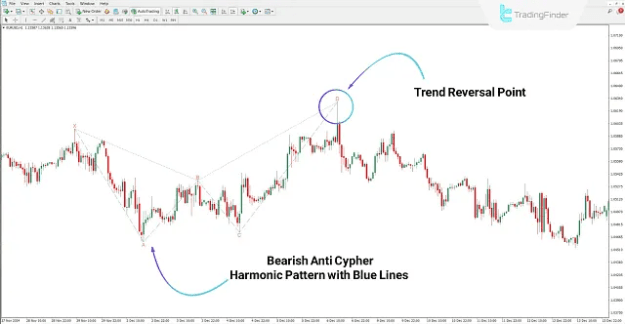
Bearish Market Application
Scenario Analysis on a Forex Chart
As illustrated on the hourly chart for the EUR/USD currency pair, the Anti Cypher Harmonic Pattern Indicator has clearly marked a bearish pattern using distinct blue lines. The chart demonstrates that after the pattern completed its structure and price arrived at point "D", the prior upward trend was terminated. This completion directly preceded the initiation of a new and sustained downward price movement, validating the indicator's sell signal.
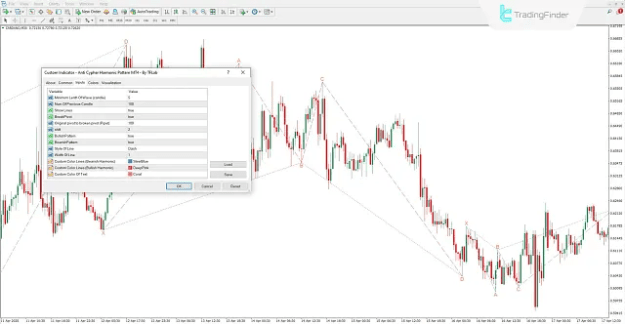
Configurable Settings Overview
The Anti Cypher Harmonic Pattern Indicator offers a suite of adjustable parameters to tailor its functionality to individual trading strategies:
- Minimum Length of Wave (candle): Defines the minimum number of candles required to form each individual wave (XA, AB, BC, CD).
- Num of Previous Candle: Sets the lookback period for identifying and validating wave structures.
- Show Lines: Toggles the visibility of the pattern lines on the chart.
- Break Pivot: Controls the display of broken pivot levels on the chart.
- Original pivot to broken pivot (Pipet): Sets the maximum allowed distance (in pipets) between an original and a broken pivot for a valid break.
- Shift: Allows the user to shift the pattern lines forward or backward along the time axis for advanced analysis.
- Bullish Pattern: Enables or disables the detection and drawing of bullish patterns.
- Bearish Pattern: Enables or disables the detection and drawing of bearish patterns.
- Style of Line: Selects the type of line (e.g., solid, dashed) used to connect the pattern points.
- Width of Line: Adjusts the thickness of the drawn pattern lines for better visibility.
- Custom Color Lines (Bearish Harmonic): Allows selection of a custom color for the bearish pattern.
- Custom Color Lines (Bullish Harmonic): Allows selection of a custom color for the bullish pattern.
Conclusion
The Anti Cypher Harmonic Pattern Indicator is a powerful technical analysis tool designed to detect potential market reversal structures and misleading breakouts. The appearance of this pattern frequently signals an impending change in market direction, thereby facilitating the identification of high-probability trade entry and exit points. Its versatile design ensures it is a valuable addition to the toolkit of traders operating across all financial markets, including cryptocurrencies, forex, stocks, and commodities.