In technical analysis, the pennant pattern is regarded as a reliable continuation signal that provides traders with confirmation of trend direction and potential breakout opportunities.
https://cdn.tradingfinder.com/file/3...4-by-tflab.zip
https://www.forexfactory.com/thread/...-in-metatrader
Prop Firm DrawDown Protector : Prop Firm Capital Protection Expert MT4 |Forex Money Management: Forex Trade Management Expert MT4 |ICT Concepts Indicator MT4 | Smart Money Concepts Expert MT4| Get a free Expert Advisor license via Telegram and WhatsApp
Pennant Pattern Indicator Features
- Indicator Categories:
- Price Action MT5 Indicators
- Trading Assist MT5 Indicators
- Chart & Classic MT5 Indicators
- Compatible Platforms:
- MetaTrader 5 Indicators
- Trading Skills Required:
- Elementary
- Timeframe Availability:
- Multi-Timeframe MT5 Indicators
- Trading Styles Supported:
- Scalping MT5 Indicators
- Day Trading MT5 Indicators
- Fast Scalping MT5 Indicators
- Applicable Instruments:
- Forex MT5 Indicators
- Crypto MT5 Indicators
- Stock MT5 Indicators
- Commodities MT5 Indicators
Pennant Pattern Overview
The Pennant Pattern represents a brief price consolidation phase in the form of a small triangular structure. This short pause in the market often occurs within a strong trend before the next price leg unfolds with even greater momentum.
To simplify recognition, the indicator uses:
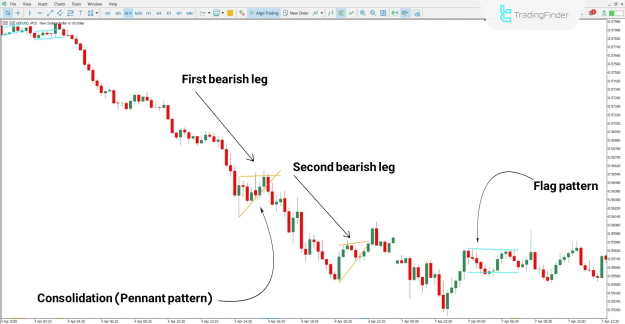
- Blue lines to highlight the Flag pattern
- Orange lines to illustrate the Pennant pattern
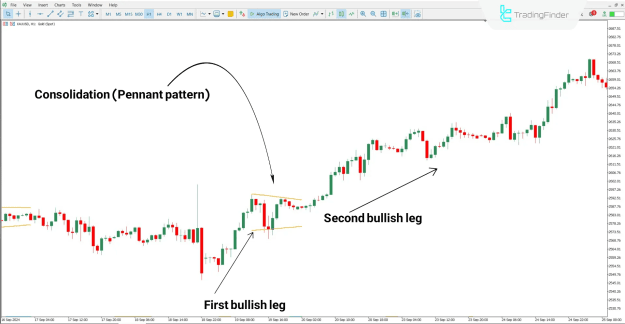
Bullish Trend Example
- On the 1-hour chart of XAU/USD (Gold vs. US Dollar), the price rallies strongly, creating the first bullish leg.
- A consolidation phase follows, where the indicator identifies and marks the Pennant Pattern.
- After a bullish breakout, the trend resumes, forming the second leg with increased acceleration.
This provides traders with an opportunity to confirm the continuation of the uptrend.
Bearish Trend Example
- On the 15-minute chart of NZD/USD, the market experiences a sharp bearish decline, forming the first leg.
- A tight consolidation develops, during which the Pennant Pattern is detected.
- A downside breakout confirms the continuation of the bearish trend, offering an ideal setup for short entries.
This makes the indicator highly effective in identifying sell-side opportunities during strong downtrends.
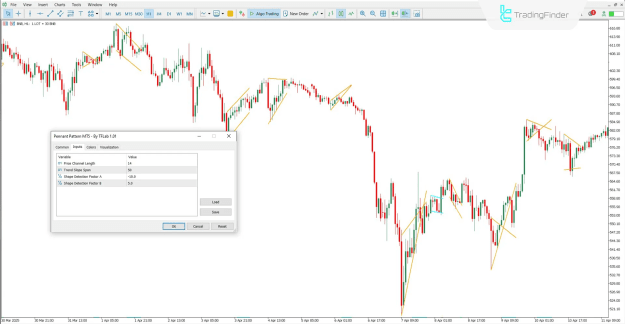
Indicator Settings
The Pennant Pattern Indicator provides several customizable parameters to adjust its functionality:
- Price Channel Length – Defines the number of candles used for channel drawing
- Trend Slope Span – Determines the slope calculation for trend measurement
- Shape Detection Factor A – Used for identifying Pennant formations
- Shape Detection Factor B – Used for identifying Flag formations
These adjustable settings allow traders to fine-tune the indicator to match different market conditions and trading strategies.
Conclusion
The Pennant Pattern Indicator is a Price Action-based trading tool that accurately identifies both Pennant and Flag formations. These continuation patterns frequently emerge after strong price movements and signal the persistence of the underlying trend.
Suitable for a wide range of markets, including Forex, Cryptocurrencies, Stocks, and Commodities, this indicator is highly adaptable for scalpers, day traders, and fast-paced strategies. It enhances pattern recognition and helps traders identify precise breakout opportunities across multiple timeframes.