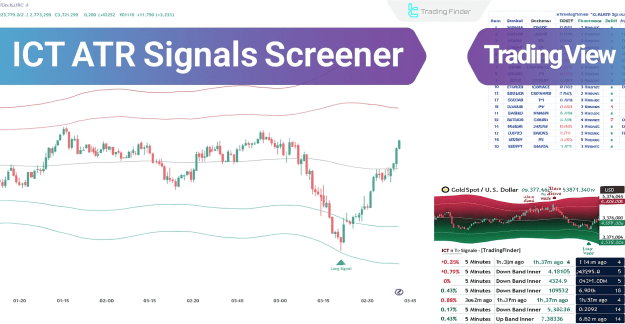
By utilizing a moving average component, the tool efficiently identifies and confirms the prevailing market trend, distinguishing between bullish and bearish conditions. Simultaneously, it incorporates the Average True Range (ATR) to quantify actual market volatility levels. Through the plotting of dynamic bands, the indicator establishes crucial support and resistance levels that adapt to changing market conditions.
The screener generates validated trading signals based on precise price interactions with these dynamic bands. Furthermore, it features an analytical dashboard capability that enables simultaneous monitoring of up to 10 trading instruments, significantly enhancing market scanning efficiency.
You can access the Indicator from this link:
https://tradingfinder.com/products/i...nals-screener/
Prop Firm DrawDown Protector : Prop Firm Capital Protection Expert MT5 |Forex Money Management: Forex Trade Management Expert MT5 | ICT Concepts Indicator MT5 |Smart Money Concepts Expert MT5 | Smart Money Trap Scanner | Get a free Expert Advisor license via Telegram and WhatsApp
Core Features and Specifications
- Indicator Categories: ICT TradingView Indicators, Smart Money Concepts, Liquidity Analysis Tools
- Platform Compatibility: Exclusive TradingView Implementation
- Required Expertise Level: Advanced Trading Proficiency
- Analysis Type: Reversal and Breakout Identification
- Timeframe Compatibility: Multi-Timeframe Analysis Capability
- Trading Style Optimization: Intraday Trading Strategies
- Market Instrument Compatibility: Forex, Cryptocurrency, Stocks, Commodities, Indices, and Share CFDs
Comprehensive Market Analysis Framework
The ICT ATR Signals Screener integrates two fundamental analytical components that work synergistically to provide complete market assessment:
Trend Identification Filter
The moving average component serves as the primary trend filter, effectively separating significant market movements from minor fluctuations and market noise. This provides traders with clear visibility of the dominant market direction.
Volatility Assessment Mechanism
The ATR-based component functions as a sophisticated volatility gauge, generating dynamic bands that serve multiple purposes. These bands not only measure volatility intensity but also establish dynamic support and resistance levels, effectively identifying critical price reaction zones and potential breakout areas.
Note: The integration of these analytical dimensions transforms the screener into a multi-layered practical tool suitable for comprehensive trend analysis, precise risk management, and identification of significant price zones.
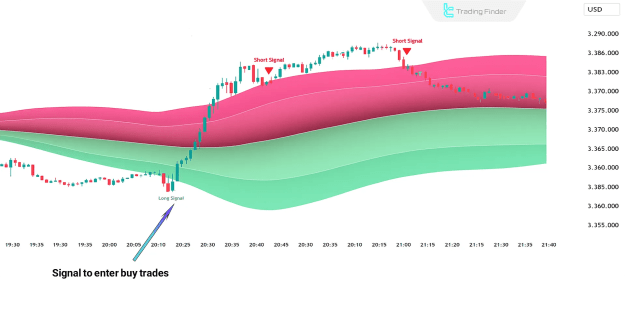
Bullish Market Configuration
In bullish market conditions, the screener demonstrates specific characteristics that facilitate accurate trading decisions:
- The prevailing trend confirms bullish when price maintains position above the moving average midline
- Valid buy signals generate when price decisively breaks above the upper ATR band with confirmation closing
- Sustained price position above the midline indicates strengthening bullish momentum
- The lower ATR band functions as dynamic support, with price touches potentially offering long entry opportunities
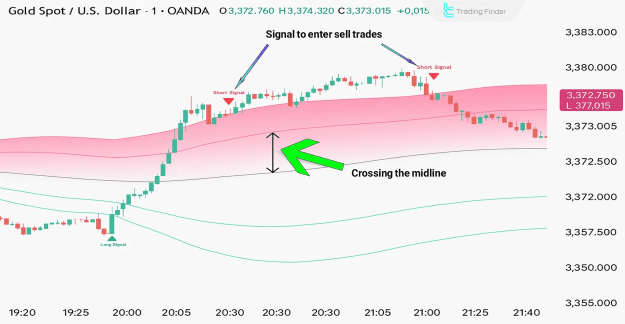
Bearish Market Configuration
In bearish market scenarios, the screener provides clear indications for strategic trading decisions:
- Bearish conditions establish when price penetrates and consolidates below the moving average midline
- Breakdowns below the lower ATR band followed by failed recoveries may signal developing bearish momentum
- The upper ATR band operates as dynamic resistance during downtrends
- Price reactions at the upper band frequently provide short entry opportunities within the prevailing downtrend
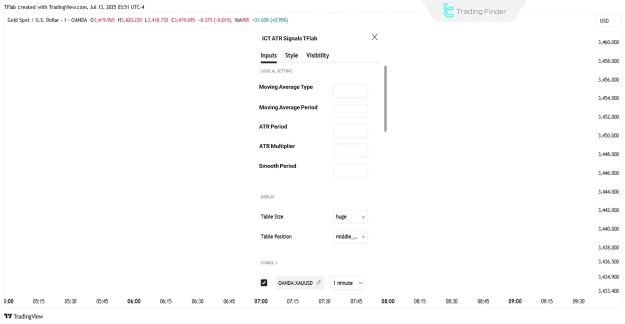
Configuration and Customization Options
The ICT ATR Signals Screener offers extensive customization through its settings panel:
Logical Configuration Parameters
- Moving Average type selection
- Moving Average period adjustment
- ATR period customization
- ATR multiplier settings
- Smoothing period configuration
- Signal gap parameters
Display and Interface Settings
- Chart table display toggle
- Symbol quantity selection (up to 10 instruments)
- Table mode configuration
- Table size adjustment
- Table positioning options
Symbol Management
- Individual symbol selection capability
- Multi-instrument monitoring setup
Alert Configuration
- Alert activation settings
- Message frequency customization
- Time zone-based alert timing
Conclusion
The ICT ATR Signals Screener provides traders with a sophisticated analytical framework through its integration of moving average trend analysis and ATR-based volatility assessment. This combination enables comprehensive market evaluation that extends beyond single-chart analysis.
The tool's dashboard functionality significantly enhances trading efficiency by facilitating simultaneous multi-instrument and multi-timeframe analysis. This comprehensive approach supports informed trading decisions across various market conditions and timeframes, making it particularly valuable for traders employing advanced trading strategies.