Furthermore, to forecast the potential direction of the next significant price movement, the indicator plots two converging trendlines. These are displayed as distinct red dashed lines, representing the dynamic support and resistance levels that define the triangle pattern and predict the critical breakout point.
https://cdn.tradingfinder.com/file/3...4-by-tflab.zip
https://www.forexfactory.com/thread/...-in-metatrader
Prop Firm DrawDown Protector : Prop Firm Capital Protection Expert MT4 | Forex Money Management: Forex Trade Management Expert MT4 |ICT Concepts Indicator MT4 | Smart Money Concepts Expert MT4| Smart Money Trap Scanner | Get a free Expert Advisor license via Telegram and WhatsAp
Core Features and Specifications
- Indicator Category: Price Action, Signal & Forecast, Chart & Classic
- Platform: Exclusively for MetaTrader 4 (MT4)
- Required Skill Level: Elementary (User-Friendly)
- Pattern Type: Breakout Identification
- Recommended Timeframe: Multi-Timeframe (M1 to W1)
- Ideal Trading Style: Intraday (Scalping and Day Trading)
- Suitable Instruments: Forex, Cryptocurrencies, Stocks, Share CFDs, and Forwards.
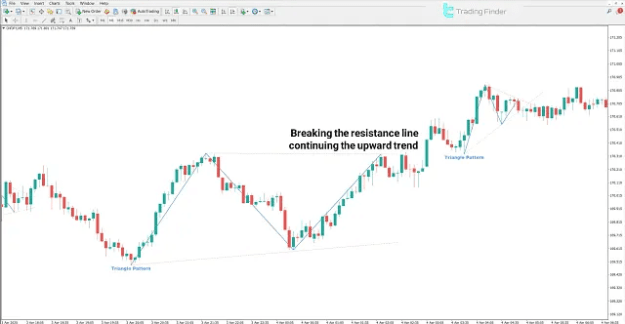
Identifying a Bullish Ascending Triangle
A textbook example of an ascending triangle pattern is formed when the market encounters a strong, static resistance level while simultaneously establishing a series of consecutively higher lows.
This creates a triangle where the upper trendline is flat (resistance) and the lower trendline is ascending (rising support). The pattern is confirmed when the price action conclusively breaks above the resistance trendline. This breakout signals a dominance of buying pressure and often precedes a substantial bullish move.
Illustrative Example: On a 5-minute chart of the CHF/JPY pair, the indicator would detect this structure, draw the blue triangle, and signal the breakout, confirming buyer strength.
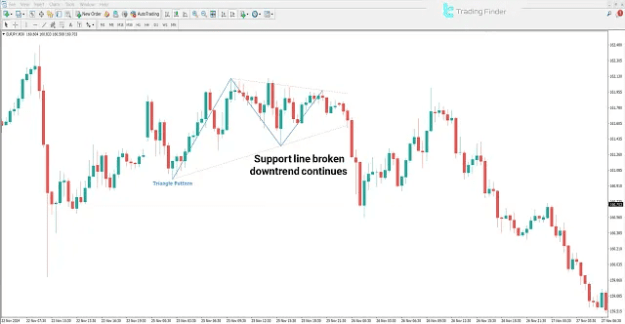
Identifying a Bearish Descending Triangle
Conversely, a descending triangle pattern signifies weakening bullish momentum. This pattern is characterized by a static support level that the price repeatedly tests, coupled with a series of lower highs.
The indicator draws the upper dashed red line by connecting these lower highs, forming a descending resistance. The lower dashed line represents the horizontal support. A valid breakdown occurs when the price closes decisively below this support zone, significantly increasing the probability of a continued bearish trend.
Illustrative Example: In a 30-minute chart of the EUR/JPY pair, the indicator would illustrate this price compression with converging lines and highlight the breakdown below dynamic support.
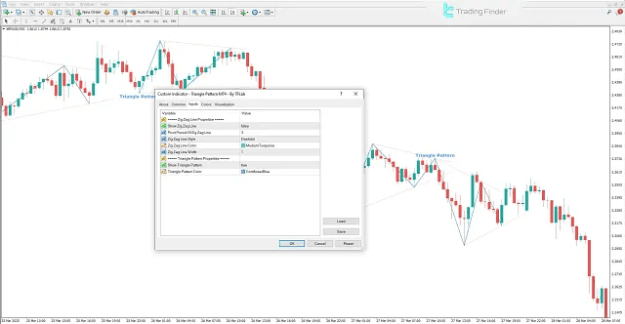
Configuring the Indicator Settings
The Triangle Pattern Indicator offers a range of customizable parameters, allowing traders to tailor its sensitivity and appearance to their specific strategy.
Key Settings Include:
- Show Zig Zag Line: Toggles the visibility of the underlying Zig Zag line used for peak/trough detection.
- Pivot Period Of Zig Zag Line: Adjusts the minimum price movement required to draw a new Zig Zag point, controlling sensitivity.
- Zig Zag Line Style/Color/Width: Customizes the visual appearance of the Zig Zag line.
- Show Triangle Pattern: Enables or disables the drawing of the blue triangle pattern.
- Triangle Pattern Color: Allows you to change the fill color of the triangle.
Conclusion
The Triangle Pattern Indicator is a powerful tool for identifying continuation patterns in the market. It represents a period of consolidation and equilibrium between buyers and sellers that typically resolves in a forceful breakout, continuing the prior trend.
This utility automates the entire process of pattern recognition—from identifying peaks and troughs to calculating trendline slopes and ultimately drawing the triangle structure. By providing clear visual signals and predicting potential breakout points with converging trendlines, it empowers traders to anticipate and capitalize on the next significant market move with greater confidence.