You can access the Indicator from this link:
https://tradingfinder.com/products/i...akout-pattern/
You can access the Indicator on the TradingView website:
https://www.tradingview.com/script/c...nal-Indicator/
Prop Firm DrawDown Protector : Prop Firm Capital Protection Expert MT4 | Forex Money Management: Forex Trade Management Expert MT4 |ICT Concepts Indicator MT4 | Smart Money Concepts Expert MT4| Smart Money Trap Scanner | Get a free Expert Advisor license via Telegram and WhatsApp
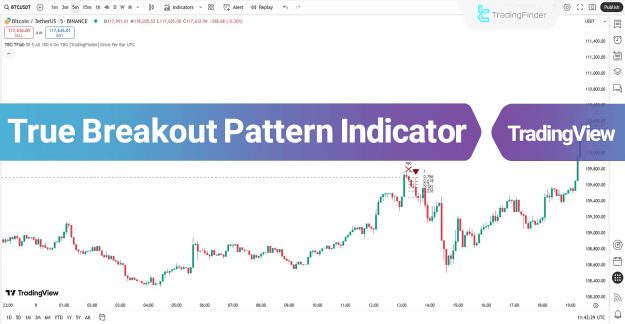
An Overview of the True Breakout Pattern Indicator
This indicator serves as a powerful ally for traders navigating complex markets. It automates the process of identifying key market structure points and filtering out deceptive price movements. By combining swing point analysis with Fibonacci retracement levels, it provides a systematic approach to trading potential reversals.
Key Specifications of the Indicator
- Trading Concepts: ICT TradingView Indicators, Smart Money TradingView Indicators, Liquidity TradingView Indicators.
- Trading Styles: Day Trading, Scalping, Swing Trading.
- Compatible Markets: Forex, Cryptocurrency, Stocks, and Commodities.
- Skill Level: Intermediate.
- Pattern Types: Reversal and Breakout TradingView Indicators.
- Timeframe Compatibility: Multi-Timeframe Analysis.
How the True Breakout Pattern Indicator Works
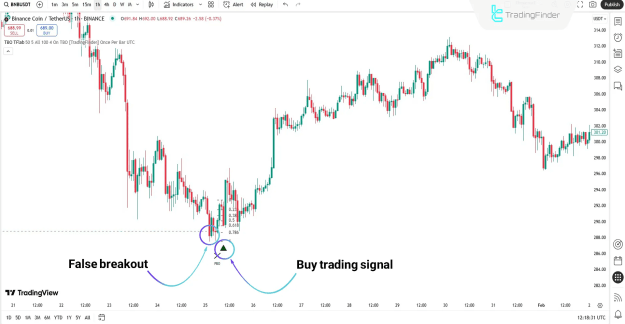
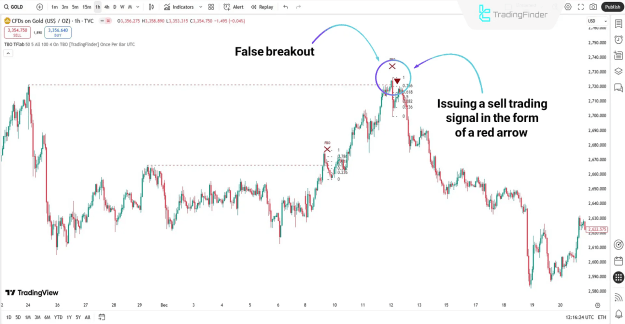
The indicator's algorithm first scans the price chart to identify significant swing highs and swing lows, which are then marked as crucial support and resistance levels. The core logic triggers when the price breaches one of these levels but then moves back inside the zone within a specified number of candles—this is classified as a false breakout.
Following this false breakout, the indicator plots Fibonacci retracement levels from the swing point. A confirmed entry signal is generated when the price retraces back to the key 0.618 or 1.0 (extension) Fibonacci levels, indicating a potential trend reversal.
Identifying a Buy Signal
A buy signal is generated under specific bullish conditions.
- The price initially breaks below a identified swing low (liquidity hunt).
- It then swiftly reverses and moves back above this level within the valid period.
- The price subsequently retraces upwards into the 0.618 to 1.0 Fibonacci retracement zone.
- Upon meeting these criteria, a green buy arrow appears, signaling the start of a potential bullish trend.
This pattern signifies that sellers were trapped, and smart money is likely initiating long positions, leading to a strong upward price movement.
Identifying a Sell Signal
A sell signal is generated under specific bearish conditions.
- The price initially breaks above a identified swing high (liquidity hunt).
- It then quickly fails and moves back below this level.
- The price subsequently retraces downwards into the 0.618 to 1.0 Fibonacci retracement zone.
- Once these conditions are confirmed, a red sell arrow appears, signaling a high-probability entry point for a short position.
This pattern indicates that buyers were trapped, and a significant downward move, driven by smart money, is likely commencing.
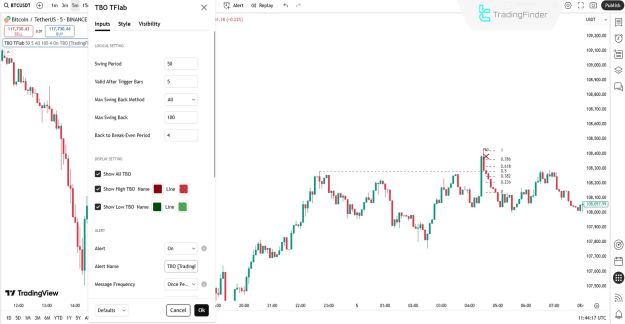
Configuring the Indicator Settings
The True Breakout Pattern Indicator offers flexible settings to tailor its behavior to your trading strategy.
Logical Settings
- Swing Period: Defines the range for detecting significant swing highs and lows.
- Valid After Trigger Bars: Sets the maximum number of candles for a breakout to be considered valid after the price returns.
- Max Swing Back & Method: Controls how many past swings are analyzed to identify structural levels.
- Back to Break-Even Period: Determines the period allotted for the price to return to the original breakout level.
Display Settings
- Show All TBO: Toggles the visibility of all valid and invalid breakout patterns.
- Show High/Low TBO: Enables/disables the labels and lines for false breakouts at swing highs and lows.
Alert Settings
- Alert: Activates trading alerts from the indicator.
- Alert Name: Allows customization of the alert message title.
- Message Frequency: Can be set to send an alert only once per candle for clarity.
Conclusion
The True Breakout Pattern Indicator is a precise and powerful tool that seamlessly integrates false breakout detection with Fibonacci retracement analysis. It effectively filters out market noise and identifies high-probability reversal zones where smart money is likely active. Its intuitive visual signals and customizable automated alerts streamline the decision-making process for traders. Suitable for various markets and trading styles, this indicator significantly enhances entry accuracy and aids in managing trading risk.