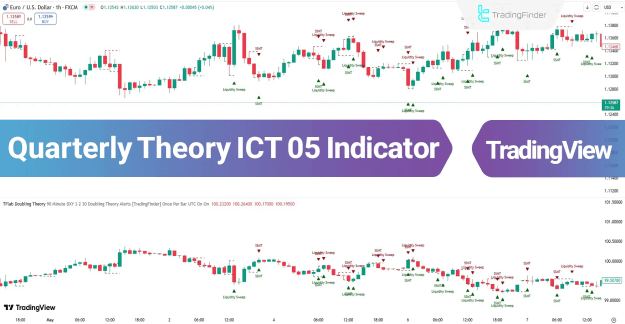
The Quarterly Theory ICT 05 Indicator is a professional trading tool built to track institutional activity, uncover liquidity zones, and highlight high-probability trade setups. Based on ICT’s Quarterly Theory, Smart Money Concepts (SMC), and time-cycle analysis, it gives traders a structured view of market behavior across multiple asset classes.
You can access the Indicator from this link:
https://tradingfinder.com/products/i...rly-theory-05/
You can access the Indicator on the TradingView website:
https://www.tradingview.com/script/P...heory-Signals/
Prop Firm DrawDown Protector : Prop Firm Capital Protection Expert MT4 | Forex Money Management: Forex Trade Management Expert MT4 |ICT Concepts Indicator MT4 | Smart Money Concepts Expert MT4| Smart Money Trap Scanner | Get a free Expert Advisor license via Telegram and WhatsApp
Core Benefits
- Combines ICT Quarterly Theory + Smart Money Concepts
- Multi-timeframe market structure analysis
- Works on forex, crypto, and stocks
- Effective for scalping, day trading & swing trading
- Designed for traders seeking institutional-level insights
Doubling Theory Signal Logic
Phase 1 – Doubling 1
- Identifies Smart Money Structural Divergence (SSMT) across correlated pairs.
- Reveals early signs of institutional positioning & trend shifts.
Phase 2 – Doubling 2
- Price returns to liquidity zones.
- Liquidity sweep confirms divergence and validates trade setups.
Example Scenarios
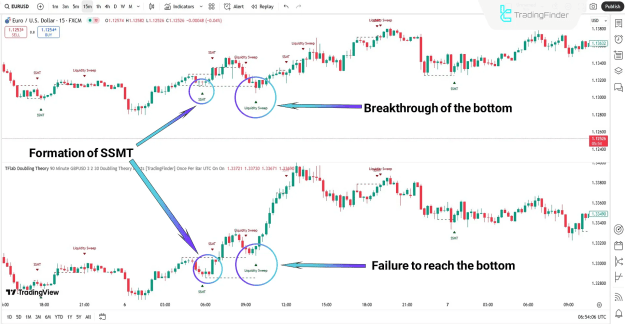
Bullish Setup
- EUR/USD breaks a low while GBP/USD holds → bearish momentum weakens.
- Liquidity sweep + SMT divergence signal bullish reversal.
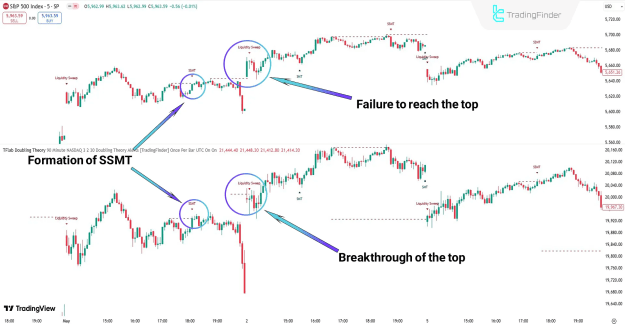
Bearish Setup
- NASDAQ makes a new high while S&P 500 lags → buying pressure fades.
- SMT divergence + support break confirm institutional distribution.
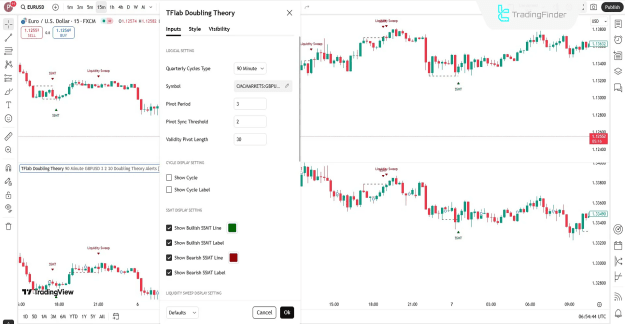
Flexible Settings
- Quarterly cycle & pivot logic adjustments
- Liquidity sweep visualization
- SMT & SSMT divergence display
- Custom alerts with timezone options
- Status bar for quick chart reference
Final Takeaway
The Quarterly Theory ICT 05 Indicator provides a powerful framework to track institutional order flow and liquidity behavior. With its divergence signals and liquidity sweep logic, traders can spot reversal zones, refine entries, and align strategies with smart money dynamics.
Attached Image(s) (click to enlarge)