You can access the Indicator from this link:
https://tradingfinder.com/products/i...ator-screener/
You can access the Indicator on the TradingView website:
https://www.tradingview.com/script/Z...RSI-ATR-Stoch/
Prop Firm DrawDown Protector : Prop Firm Capital Protection Expert MT5 |Forex Money Management: Forex Trade Management Expert MT5 | ICT Concepts Indicator MT5 |Smart Money Concepts Expert MT5 | Smart Money Trap Scanner | Get a free Expert Advisor license via Telegram and WhatsApp
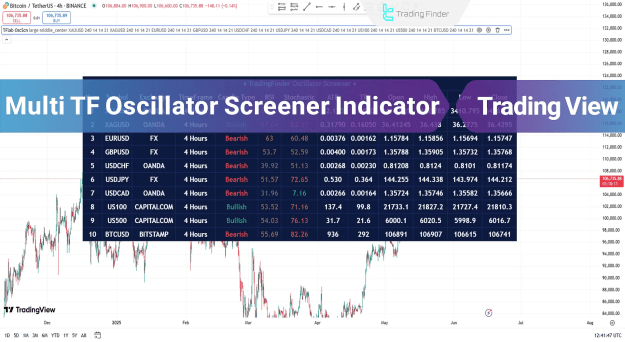
Key Features of the Indicator
Comprehensive Market Overview
- Multi-Symbol Tracking: Monitor up to 10 different assets simultaneously
- Multi-Timeframe Analysis: View each symbol across multiple timeframes
- Advanced Oscillator Integration: RSI, Stochastic, and ATR data for each symbol
- Visual Trend Indicators: Color-coded bullish/bearish candlestick status
Trading Advantages
Saves time on manual asset monitoring
Provides consolidated market analysis
Works across forex, stocks, and indices
Ideal for multi-asset portfolio management
How the Indicator Works
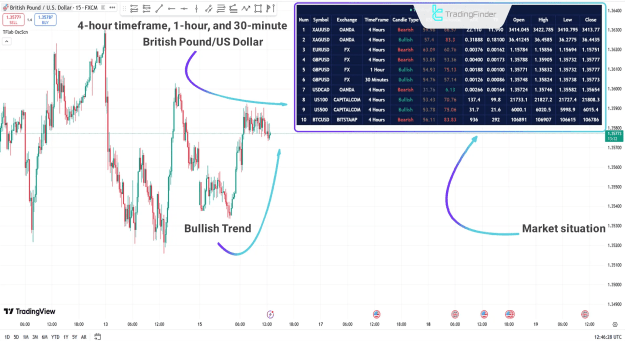
Bullish Market Analysis
- Panel displays green candlestick indicators
- RSI and Stochastic show bullish momentum
- Multiple timeframe confirmation
- Traders can identify strong buy opportunities
*Example: GBP/USD showing bullish alignment across 3 timeframes*
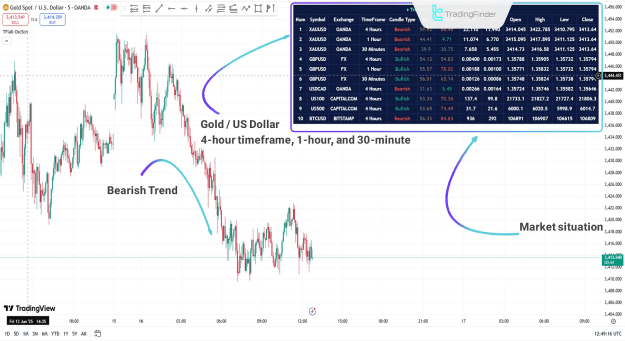
Bearish Market Analysis
- Panel shows red candlestick indicators
- Oscillators indicate oversold or weakening conditions
- Multi-timeframe bearish confirmation
- Traders can identify potential short opportunities
Example: XAU/USD showing bearish momentum across timeframes
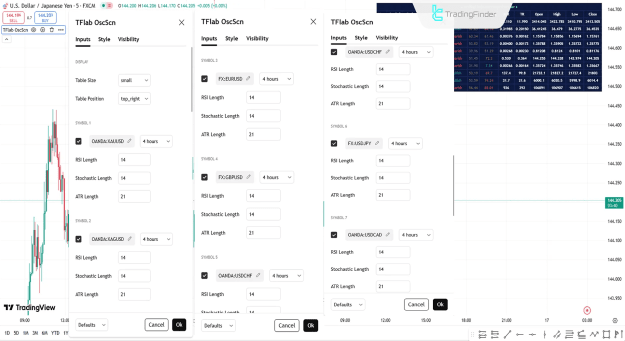
Indicator Configuration
Display Settings
- Table Size: Adjust panel dimensions for optimal viewing
- Table Position: Customize screen location
- Symbol Selection: Choose up to 10 trading instruments
- Timeframe Settings: Set different timeframes for each symbol
Technical Settings
- RSI Length: Customize RSI period sensitivity
- Stochastic Configuration: Adjust %K and %D periods
- ATR Period: Set Average True Range parameters
- Visual Preferences: Customize colors and display options
Optimal Trading Strategy
- Panel Setup: Configure 5-8 key symbols and timeframes
- Market Scan: Review overall market sentiment from panel
- Divergence Detection: Identify assets showing strongest signals
- Timeframe Alignment: Look for multi-timeframe confirmation
- Focus Trading: Concentrate on assets with clearest signals
Why Professional Traders Use This Screener
- Efficiency: Replaces multiple chart windows
- Comprehensive Analysis: Provides oscillator data across timeframes
- Customization: Adapts to individual trading preferences
- Real-time Monitoring: Instant market sentiment updates
Conclusion
The Multi TF Oscillator Screener transforms market analysis by providing:
- Consolidated multi-asset monitoring
- Multi-timeframe technical analysis
- Real-time market sentiment assessment
- Professional-grade portfolio overview
This advanced TradingView tool is essential for traders who:
Manage multiple trading instruments
Require quick market overviews
Need multi-timeframe confirmation
Want to save time on market analysis