This powerful indicator categorizes trendlines into four distinct types—Major, Minor, Internal, and External—each serving a unique purpose in a trader's strategy. Traders leverage these dynamic lines to:
- Identify the overarching market structure and trend direction.
- Gauge the relative strength of buying and selling pressure.
- Locate dynamic support and resistance zones that evolve with price.
- Pinpoint high-probability entry and exit points for trades.
You can access the Indicator from this link:
https://tradingfinder.com/products/i...to-trendlines/
You can access the Indicator on the TradingView website:
https://www.tradingview.com/script/h...Signal-Alerts/
Prop Firm DrawDown Protector : Prop Firm Capital Protection Expert MT5 |Forex Money Management: Forex Trade Management Expert MT5 | ICT Concepts Indicator MT5 |Smart Money Concepts Expert MT5 | Smart Money Trap Scanner | Get a free Expert Advisor license via Telegram and WhatsApp
Visual Clarity and Market Direction
To enhance chart clarity and facilitate instant market direction detection, the indicator employs a specific color and style scheme:
- Major Uptrend Line: Solid Green
- Major Downtrend Line: Solid Red
- Minor Uptrend Line: Dashed Green
- Minor Downtrend Line: Dashed Red
How to Utilize the Auto TrendLines Indicator in TradingView
Integrating this indicator into your TradingView workflow simplifies the process of trend analysis. Once applied to a chart, it immediately begins plotting the relevant trendlines based on its algorithm. The key to usage lies in interpreting the price's interaction with these lines and heeding the generated signals.
Comprehensive Indicator Overview
The core function of the Auto TrendLines Indicator is to help traders identify critical zones on the chart, including:
- Potential trend reversal areas.
- Impending breakout points.
- Dynamic support and resistance levels.
This functionality is paramount for determining the market’s prevailing direction. The indicator is further enhanced with a robust alert system; when price either touches or breaks a significant trendline, it can trigger real-time trade alerts. This enables faster decision-making, which is crucial in volatile market conditions.
Interpreting Signal Arrows
The indicator provides clear, visual trade signals through arrows that appear upon price interaction with a trendline:
- Green Arrow: Represents a bullish signal, suggesting a potential buying opportunity or trend continuation upward.
- Red Arrow: Represents a bearish signal, suggesting a potential selling opportunity or trend continuation downward.
These signals are designed to assist in quick analysis and facilitate timely trade entries, removing emotional bias from the decision-making process.
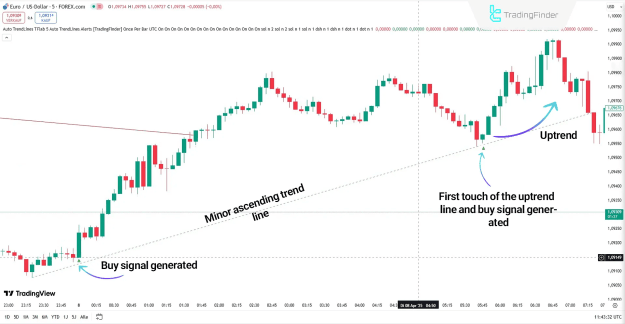
Practical Application: Bullish Trend Scenario
On a 5-minute EUR/USD chart, the price approaches and touches a minor trendline (visualized as a dashed green line). This interaction triggers a green arrow buy signal. The price action shows the level acting as support. After a subsequent revisit that holds this same dynamic support, the price initiates a strong upward move, validating the signal.
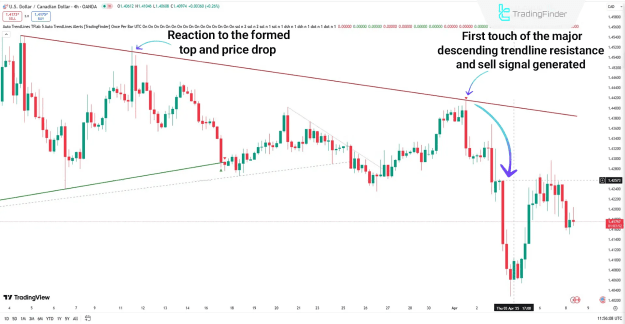
Practical Application: Bearish Trend Scenario
On a 4-hour USD/CAD chart, the indicator detects a valid major trendline. The price can be seen reacting to this zone multiple times. Upon failing to break above this level, the indicator displays a definitive red arrow sell signal. This signal often indicates the continuation of the existing downtrend. Traders can seek confirmation using complementary strategies like candlestick pattern analysis or confluence with key horizontal levels before entering short positions.
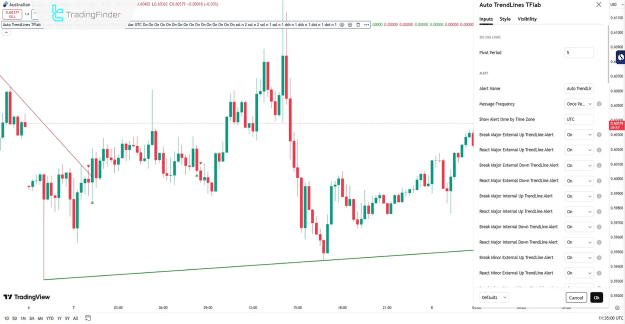
Configuring the Auto TrendLines Indicator Settings
The indicator offers a deep level of customization within TradingView's settings menu, allowing users to tailor its behavior to their specific trading style.
Core Algorithm: Zig Zag Logic
- Pivot Period: This setting adjusts the sensitivity of the underlying Zig Zag logic used to identify significant price pivots (swing highs and lows). A higher period will ignore smaller fluctuations and draw longer-term trendlines, while a lower period will make the indicator more sensitive to minor price movements.
Alert Configuration
The alert system is highly granular, allowing for alerts on every type of trendline interaction. Key settings include:
- Alert Name: Customize the name for your alert.
- Message Frequency: Control how often you receive alert notifications (e.g., once per bar close, only once).
- Show Alert Time by Time Zone: Display alert timestamps in your local time zone.
- Break/React Alerts: Individual toggles and settings for alerts when price either breaks through or reacts off of (bounces from) each specific trendline type (e.g., Break Major External Up TrendLine Alert, React Major Internal Down TrendLine Alert).
Trendline Customization (Major & Minor)
For each category of trendline (Major External Up/Down, Major Internal Up/Down, etc.), users can configure:
- Visibility: Toggle whether the specific line type is shown on the chart.
- Delete Previous: Control whether previous instances of the line are deleted, keeping the chart clean.
- Color: Customize the line color.
- Style: Choose the line style (e.g., solid, dashed, dotted).
- Extend: Choose whether the line extends infinitely to the right.
- Width: Adjust the thickness of the trendline.
Conclusion
The Auto TrendLines Indicator for TradingView is a powerful and efficient tool that automates a critical aspect of technical analysis. By objectively drawing and categorizing trendlines based on actual price behavior, it provides traders with clear insights into market dynamics, trend direction, and key dynamic support/resistance zones.
Its standout feature is a comprehensive, real-time alert system that notifies traders the moment price breaks or reacts to a significant trendline, complemented by clear visual signals via colored arrows. Coupled with its fully customizable settings, this indicator is an invaluable asset for traders of all skill levels seeking to enhance their market analysis and execution speed.