You can access the Indicator from this link:
https://tradingfinder.com/products/i...theory-ict-02/
You can access the Indicator on the TradingView website:
https://www.tradingview.com/script/w...ession-90-Min/
Prop Firm DrawDown Protector : Prop Firm Capital Protection Expert MT4 | Forex Money Management: Forex Trade Management Expert MT4 |ICT Concepts Indicator MT4 | Smart Money Concepts Expert MT4| Smart Money Trap Scanner | Get a free Expert Advisor license via Telegram and WhatsApp
Key Features of the Indicator
Core Functionality
- Multi-Timeframe True Open Levels: Plots yearly, monthly, weekly, daily, and 90-minute session opens
- Session-Specific Analysis: Marks Asian, London, and New York session True Open levels
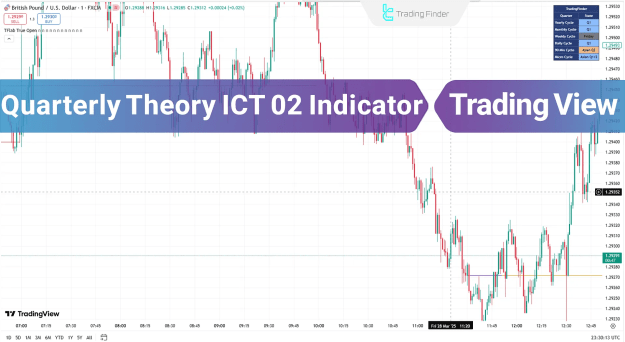
- Market Phase Table: Provides real-time market condition analysis (top-right corner)
- Visual Clarity: Clear price level markers with extendable lines
Trading Advantages
Identifies key support/resistance levels
Works across forex, indices, and stocks
Suitable for intraday, day trading, and scalping
Provides objective entry/exit points
How the Indicator Works
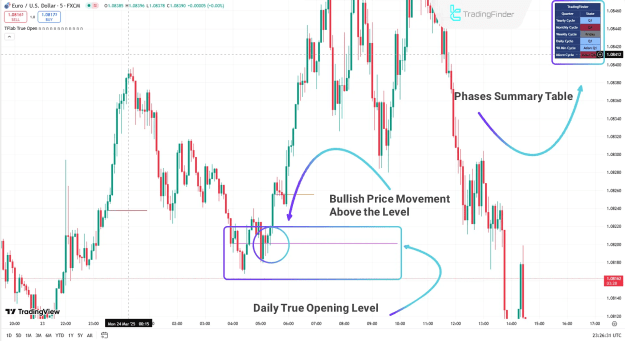
Bullish Scenario (Uptrend)
- Price sustains above Daily True Open level
- Market phase table confirms bullish conditions
- Traders can enter long positions with confidence
- Target next resistance level or session high
*Example: EUR/USD 5M chart showing bullish momentum above True Open*
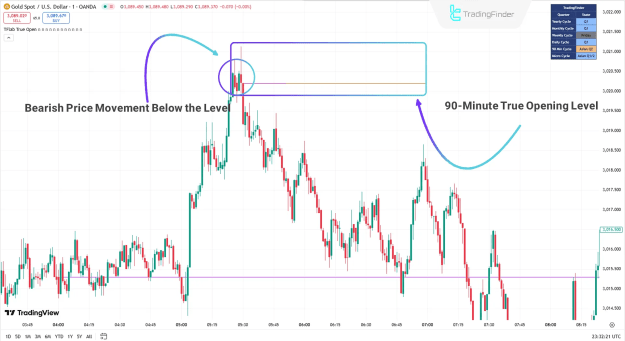
Bearish Scenario (Downtrend)
- Price breaks below 90-minute True Open level
- Phase table indicates bearish momentum
- Traders can enter short positions on confirmation
- Target next support level or session low
Example: Gold 1M chart showing breakdown below True Open
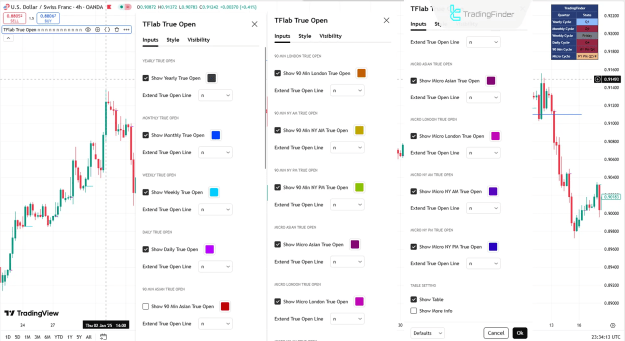
Indicator Customization
Comprehensive Settings Panel
- True Open Toggles: Enable/disable yearly, monthly, weekly, daily, and session-specific levels
- Line Extension: Extend True Open lines for better visibility
- Table Settings: Control phase table display and information detail
- Session Focus: Asian, London, NY AM, and NY PM session True Open levels
Optimal Trading Strategy
- Identify Key True Open Level: Determine the most relevant True Open (e.g., Daily for swing trades, 90-minute for intraday)
- Monitor Price Reaction: Watch for rejection or acceptance at True Open level
- Confirm with Phase Table: Check market condition in phase table
- Enter with Confluence: Wait for additional confirmation (candlestick patterns, volume)
- Manage Risk: Place stops beyond recent swing points
Why Traders Choose This Indicator
- ICT-Aligned Methodology: Follows proven Smart Money Concepts
- Multi-Timeframe Flexibility: Adapts to various trading styles
- Clear Visual Guidance: Eliminates manual level drawing
- Actionable Insights: Phase table provides market context
Conclusion
The Quarterly Theory ICT 02 Indicator provides traders with an institutional-grade framework for:
- Identifying key price levels
- Analyzing market structure
- Timing entries and exits
- Understanding market phases
This free TradingView tool is indispensable for traders who want to:
Trade with institutional levels
Understand market structure shifts
Improve timing precision
Reduce emotional decision-making