Within these phases, the classic market cycle of Accumulation, Manipulation (Judas Swing), Distribution, and eventual Continuation or Reversal unfolds in a predictable, repetitive manner. The indicator automates the identification of these phases, providing a structured lens through which to view market activity.
You can access the Indicator from this link:
https://tradingfinder.com/products/i...rterly-theory/
You can access the Indicator on the TradingView website:
https://www.tradingview.com/script/q...1-Q4-Sessions/
Prop Firm DrawDown Protector : Prop Firm Capital Protection Expert MT4 | Forex Money Management: Forex Trade Management Expert MT4 |ICT Concepts Indicator MT4 | Smart Money Concepts Expert MT4| Smart Money Trap Scanner | Get a free Expert Advisor license via Telegram and WhatsApp
Core Specifications and Trading Profile
The Quarterly Theory ICT Indicator is designed for advanced market cycle analysis, falling into several key analytical categories.
Primary Indicator Categories:
- ICT TradingView Indicators
- Session & KillZone TradingView Indicators
- Cycles TradingView Indicators
Recommended User Proficiency:
- Advanced Trading Skills
Core Analytical Function:
- Identifies potential market Reversals and Breakout points.
Compatible Timeframe Analysis:
- Multi-Timeframe TradingView Indicators
Optimal Trading Application:
- Day Trading TradingView Indicators
Supported Markets and Instruments:
- Forex (Foreign Exchange Market)
- Cryptocurrency Markets
- Stock (Equities) Markets
- Futures Markets
The Four Phases of the Market Cycle
The indicator's framework is built on a quarterly system that mirrors seasonal cycles, each representing a critical stage in market sentiment and institutional activity.
- Q1- The Accumulation Phase
The market experiences consolidation, often within a defined range. This phase represents institutional positioning and liquidity collection, setting the foundation for the next significant trend.
- Q2- The Manipulation Phase (Judas Swing)
Characterized by sudden, sharp price movements and false breakouts. This "Judas Swing" is designed to trap retail traders on the wrong side of the market before the true trend direction is revealed.
- Q3- The Distribution Phase
The period of highest volatility where large-scale distribution of positions occurs. Price often exhibits explosive movement as smart money exits its positions.
- Q4- The Continuation/Reversal Phase
The decisive phase where the market either resumes the original trend initiated after accumulation or undergoes a complete reversal, beginning a new cyclical sequence.
Practical Trading Applications
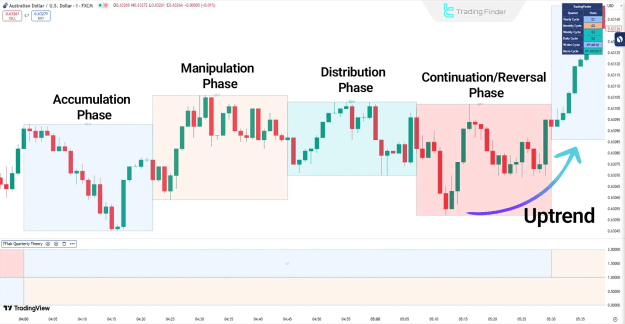
Bullish Cycle Example
An analysis of the AUD/USD chart demonstrates a complete bullish cycle. The price first enters the Accumulation Phase (Q1), establishing a base.
This is followed by the Manipulation Phase (Q2), where a false breakout to a higher high liquidates late sellers and traps bullish retail traders. After this deception, the market moves into the Distribution Phase (Q3).
Finally, in the fourth phase (Q4), the price breaks out definitively, confirming the start of the main bullish impulse move.
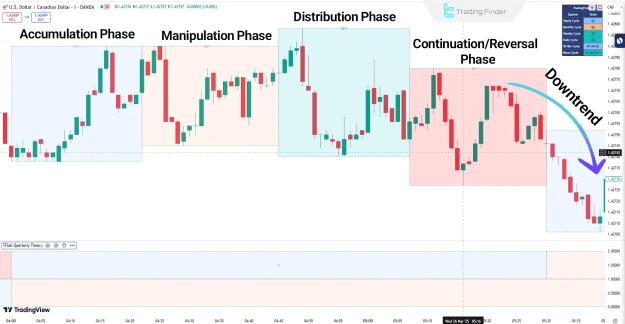
Bearish Cycle Example
Conversely, on a USD/CAD chart, the cycle can be observed in a bearish context. The Accumulation Phase (Q1) occurs during an upward move, collecting buy-side liquidity.
The Manipulation Phase (Q2) then triggers a deceptive price drop, misleading traders into premature short positions. The subsequent Distribution Phase (Q3) creates a new high, trapping sellers and stopping out weak longs.
The cycle culminates in Q4 with a powerful resumption of the underlying bearish trend.
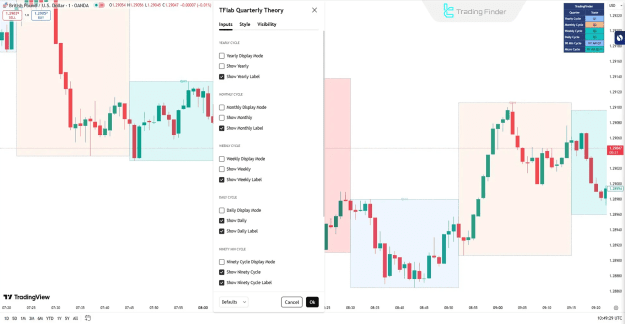
Comprehensive Configuration Settings
The indicator offers unparalleled customization, allowing traders to visualize cycles across multiple timeframes simultaneously.
Cycle Display Settings:
The settings panel allows users to enable or disable the visualization and labeling for various cycle periods, including:
- Yearly Cycle: For long-term strategic positioning.
- Monthly & Weekly Cycles: For swing trading and intermediate-term analysis.
- Daily Cycle: For day trading frameworks.
- Ninety-Minute & Micro Cycles: For short-term and scalping precision.
Table Settings:
- Table Display Mode: Activates a data table for a clean, numerical overview of cycle phases.
- Show More Info: Expands the table to provide additional, detailed metrics on each phase.
Conclusion
The Quarterly Theory ICT Indicator is more than a simple tool; it is a comprehensive strategic framework rooted in ICT's teachings on market structure, liquidity, and time. By automating the identification of Accumulation, Manipulation, Distribution, and Continuation/Reversal phases across all timeframes, it provides traders with a profound edge in forecasting market direction and developing high-probability trading strategies.