You can access the Indicator from this link:
https://tradingfinder.com/products/i...cloud-pattern/
You can access the Indicator on the TradingView website:
https://www.tradingview.com/script/1...chart-Pattern/
Prop Firm DrawDown Protector : Prop Firm Capital Protection Expert MT5 |Forex Money Management: Forex Trade Management Expert MT5 | ICT Concepts Indicator MT5 |Smart Money Concepts Expert MT5 | Smart Money Trap Scanner |Get a free Expert Advisor license via Telegram and WhatsApp
What is the Dark Cloud Pattern Indicator?
The Dark Cloud Pattern Indicator is developed to detect trend reversal points with precision.
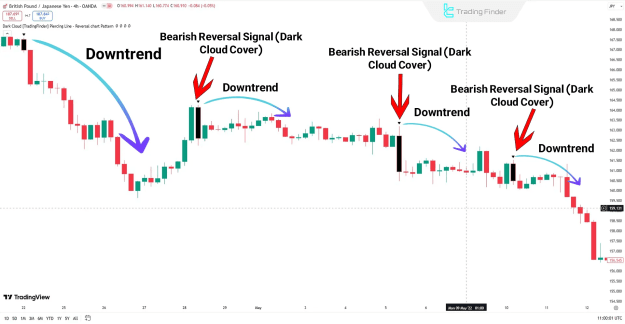
- Dark Cloud Cover: A bearish reversal candlestick pattern that typically forms at the end of an uptrend.
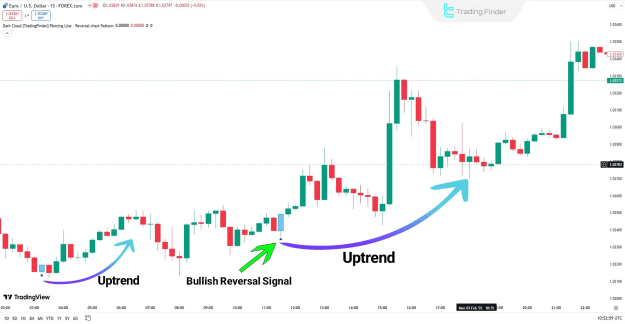
- Piercing Line: A bullish reversal candlestick pattern that often develops at the bottom of a downtrend.
These signals help traders identify entry and exit points across different markets, enhancing decision-making in dynamic trading environments.
Key Features of the Dark Cloud Pattern Indicator
This TradingView reversal tool comes with multiple categories, platforms, and styles:
- Indicator Categories
- Signal & Forecast indicators
- Trading Assist indicators
- Chart & Classic indicators
- Platforms
- TradingView indicators
- Trading Skills Required
- Intermediate level
- Indicator Types
- Reversal candlestick indicators
- Timeframes
- Multi-timeframe compatibility
- Trading Styles
- Day trading setups
- Applicable Instruments
- Forex pairs
- Cryptocurrency markets
- Stocks and equities
- Shares and forward contracts
How the Dark Cloud Pattern Indicator Works
The Dark Cloud Reversal Indicator displays potential entry signals through distinct chart symbols:
- Bearish Signals
- A red circle indicates a strong bearish reversal (Dark Cloud Cover).
- If weaker, a black arrow is displayed instead.
- Bullish Signals
- A green circle indicates a strong bullish reversal (Piercing Line).
- If weaker, a blue arrow is shown.
Indicator in an Uptrend
When price approaches support zones or previous market lows, the indicator analyzes candlestick structures.
- If a bullish candle covers more than 50% of the previous candlestick body, a bullish entry signal is generated.
- Confirmation of the Piercing Line pattern displays a green circle, while weaker formations are represented by a blue arrow.
Indicator in a Downtrend
When price reaches resistance zones or prior highs, the indicator monitors potential trend reversals.
- If a bearish candle follows a bullish candle and covers more than 50% of its body, a sell signal is generated.
- A red circle confirms a strong Dark Cloud Cover pattern, while weaker setups are shown with a black arrow.
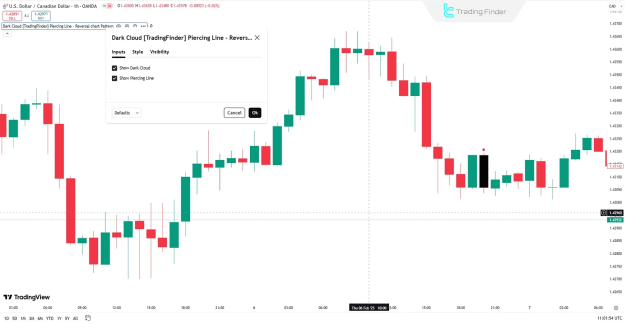
Dark Cloud Pattern Indicator Settings
The customizable settings of this TradingView tool allow traders to refine their strategies:
- Show Dark Cloud: Enables the bearish Dark Cloud Cover pattern.
- Show Piercing Line: Enables the bullish Piercing Line pattern.
Conclusion
The Dark Cloud Pattern Indicator is an effective TradingView reversal tool that identifies entry points within bullish and bearish market structures. By detecting candlestick reversal patterns, this indicator supports traders in forecasting potential trend changes, making it a valuable addition to any technical analysis toolkit.