You can access the Indicator from this link:
https://tradingfinder.com/products/i...iew/son-model/
You can access the Indicator on the TradingView website:
https://www.tradingview.com/script/z...ep-M15-FVG-M1/
Prop Firm DrawDown Protector : Prop Firm Capital Protection Expert MT5 |Forex Money Management: Forex Trade Management Expert MT5 | ICT Concepts Indicator MT5 |Smart Money Concepts Expert MT5 | Smart Money Trap Scanner |Get a free Expert Advisor license via Telegram and WhatsApp
Understanding the Son Model ICT Indicator
The Son Model ICT Indicator identifies liquidity accumulation zones, waits for a structural shift in the market, and then confirms a valid fair value gap (FVG). If price retraces into this zone, traders may consider entering trades aligned with the market direction.
- Liquidity Signal – Recognizes liquidity buildup in the market.
- Market Structure Shift (MSS) – Confirms a structural change in price action.
- Fair Value Gap (FVG) – Marks imbalance zones for potential trade entries.
Key Features of the Son Model ICT Indicator
Indicator Categories
- ICT TradingView Indicators
- Smart Money TradingView Indicators
- Liquidity TradingView Indicators
- Currency Strength Indicators
Supported Platforms
- TradingView
Suitable Trading Skills
- Intermediate Level Traders
Indicator Types
- Lagging Indicators
- Entry & Exit Indicators
Applicable Timeframes
- M1–M5 TradingView Indicators
Trading Styles
- Intraday Trading
- Day Trading
- Scalping
Trading Instruments
- Forex Pairs
- Stocks
- Indices
Bullish Trend Example
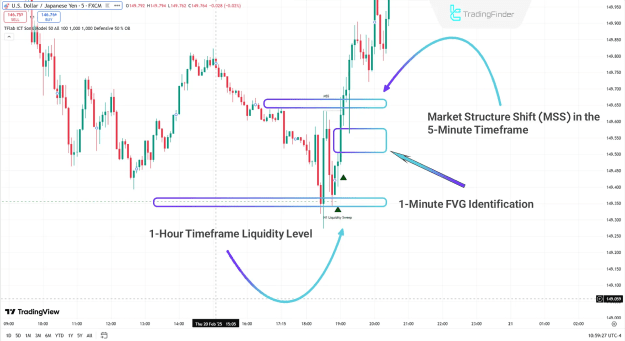
On the USD/JPY 5-minute chart, the Son Model ICT Indicator detected liquidity accumulation on the 5-hour timeframe. After confirming a market structure shift (MSS), price revisited the FVG zone with a shadow and then extended its bullish trend.
- Liquidity Accumulation – Identified at higher timeframe levels.
- Market Structure Shift – Signals the start of bullish pressure.
- FVG Confirmation – Price retests the imbalance before trending upward.
Bearish Trend Example
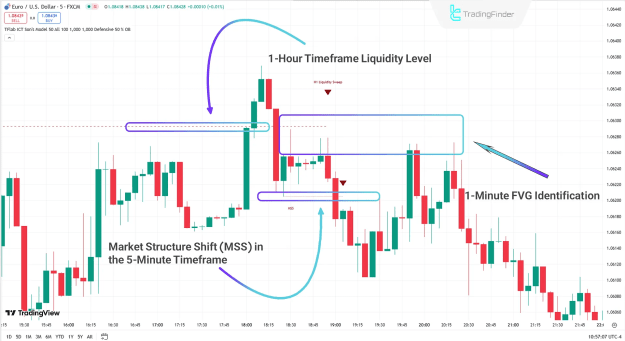
On the EUR/USD 5-minute chart, liquidity levels were identified on the 1-hour timeframe. After building liquidity, price shifted downward. Following the MSS confirmation, the market retraced to the fair value gap (FVG) zone and continued declining.
- Liquidity Levels – Highlighted before the downward move.
- MSS Confirmation – Market signals bearish direction.
- FVG Retest – Price returns to the imbalance range before falling further.
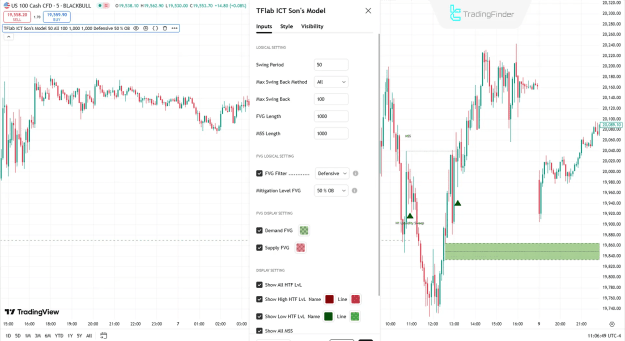
Son Model ICT Indicator Settings
Logical Settings
- Swing Period – Defines swing identification periods.
- Max Swing Back Method – Two modes: “All” (analyzes all swings) and “Custom” (limits analysis to a chosen number of swings).
- Max Swing Back – Sets the number of swings to analyze.
- FVG Length – Determines the validity of an FVG in terms of candle count.
- MSS Length – Defines the validity of MSS based on candles.
FVG Logical Settings
- FVG Filter – Filters fair value gaps for high-quality signals.
- Types of FVG Filters:
- Very Aggressive Filter – Uses extreme candle highs and lows.
- Aggressive Filter – Removes very small middle candles.
- Defensive Filter – Considers candle body size and polarity.
- Very Defensive Filter – Excludes small doji candles for stronger signals.
- Mitigation Levels of FVG:
- Proximal – Closest level; invalidated when touched.
- 50 Level – Midpoint of the FVG; invalidated when reached.
- Distal – Farthest level; invalidated when price touches it.
FVG Display Settings
- Enable or disable display of Demand FVG and Supply FVG.
Display Settings
- Show or hide higher timeframe levels and their labels.
- Show or hide market structure shifts (MSS) and their names.
Conclusion
The Son Model ICT Indicator is a specialized liquidity-based TradingView indicator developed with ICT principles. It operates across three critical stages to refine trade entries:
- Liquidity Identification – Higher timeframe analysis (1H).
- Market Structure Shift – Confirmation in the 5-minute timeframe.
- Fair Value Gap – Final entry signal in the 1-minute chart.
By combining liquidity zones, MSS confirmation, and FVG retests, traders can use the Son Model ICT Indicator to conduct more precise analysis and discover improved trading opportunities in forex, stocks, and indices.