The Divergence Signal Indicator is an advanced TradingView tool that automatically identifies hidden trend reversals by detecting discrepancies between price action and key oscillators. This free indicator marks potential reversal zones with clear visual boxes, providing traders with early warning signals for market turns.
You can access the Indicator from this link:
https://tradingfinder.com/products/i...rgence-signal/
You can access the Indicator on the TradingView website:
https://www.tradingview.com/script/y...rsal-On-Swing/
Prop Firm DrawDown Protector : Prop Firm Capital Protection Expert MT4 | Forex Money Management: Forex Trade Management Expert MT4 |ICT Concepts Indicator MT4 | Smart Money Concepts Expert MT4| Smart Money Trap Scanner | Get a free Expert Advisor license via Telegram and WhatsApp
Key Features of the Indicator
Core Functionality
You can access the Indicator from this link:
https://tradingfinder.com/products/i...rgence-signal/
You can access the Indicator on the TradingView website:
https://www.tradingview.com/script/y...rsal-On-Swing/
Inserted Video
Prop Firm DrawDown Protector : Prop Firm Capital Protection Expert MT4 | Forex Money Management: Forex Trade Management Expert MT4 |ICT Concepts Indicator MT4 | Smart Money Concepts Expert MT4| Smart Money Trap Scanner | Get a free Expert Advisor license via Telegram and WhatsApp
Key Features of the Indicator
Core Functionality
- Multi-Oscillator Analysis: Scans MACD, RSI, and Awesome Oscillator
- Visual Signals:
- Gray boxes for bullish divergence
- Orange boxes for bearish divergence
- Real-time Alerts: Notifies of divergence formations
- Multi-Timeframe Support: Works from M1 to W1 charts
Trading Advantages
Early reversal detection
Works across all markets
Clear visual representation
Customizable sensitivity
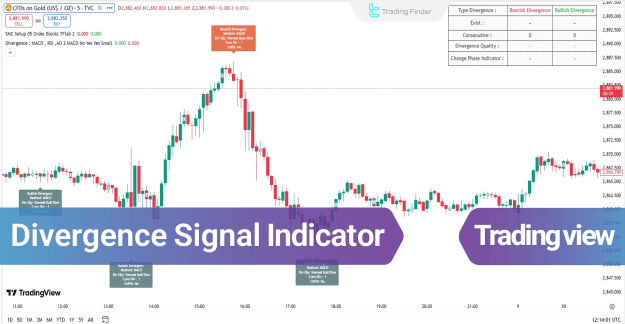
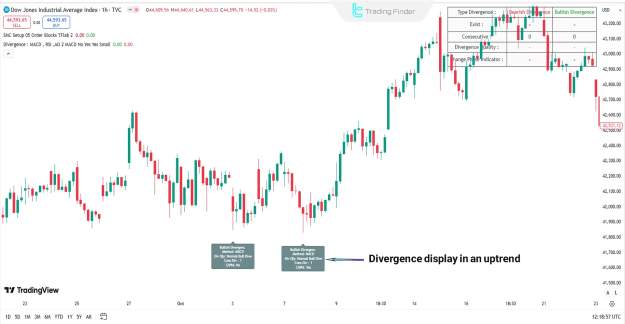
Understanding Divergence Types
Bullish Divergence (Gray Boxes)
- Price makes lower lows
- Oscillator shows higher lows
- Indicates selling exhaustion
- Signals potential upward reversal
Example: DJI 1H chart showing bullish divergence before rally
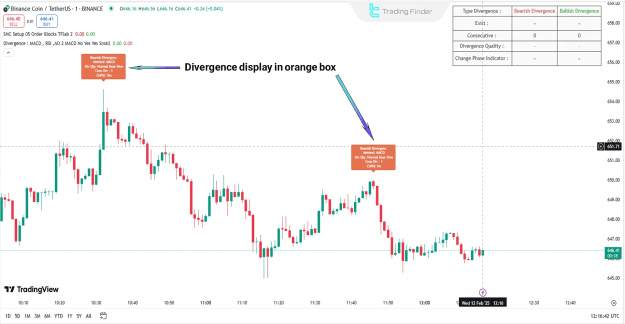
Bearish Divergence (Orange Boxes)
- Price makes higher highs
- Oscillator shows lower highs
- Indicates buying exhaustion
- Signals potential downward reversal
Example: BNB 1M chart showing bearish divergence before drop
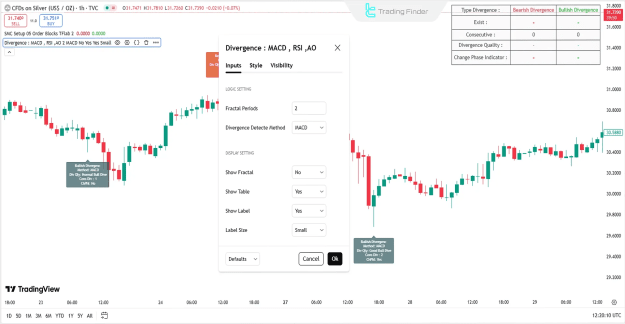
Indicator Configuration
Key Settings
- Fractal Periods: Adjust pattern sensitivity
- Detection Method: Choose oscillator combinations
- Display Options:
- Toggle fractal markers
- Show/hide information table
- Adjust label sizes
Optimal Trading Strategy
- Confirm Divergence: Wait for box formation
- Check Confluence:
- Support/resistance levels
- Volume confirmation
- Candlestick patterns
- Enter Cautiously:
- Bullish: After gray box + momentum shift
- Bearish: After orange box + rejection signs
- Manage Risk:
- Stop beyond recent swings
- Target previous structure levels
Why Traders Choose This Indicator
- Multi-Oscillator Accuracy: Reduces false signals
- Visual Clarity: Easy pattern recognition
- Versatile Application: Forex, stocks, crypto
- Beginner-Friendly: Simple interpretation
Conclusion
The Divergence Signal Indicator provides traders with a sophisticated yet accessible tool for:
- Detecting early trend weakness
- Identifying potential reversal zones
- Combining multiple oscillator analysis
- Enhancing entry timing accuracy
Ideal for traders who want to:
Anticipate trend changes
Avoid chasing movements
Combine with price action analysis
Trade across multiple timeframes
Attached Image(s) (click to enlarge)