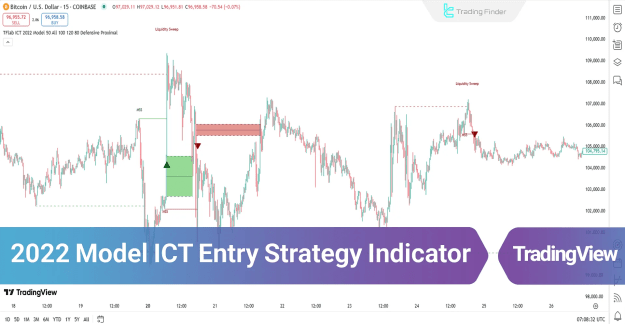
A prime example can be observed on the Bitcoin price chart, where the ICT Entry Strategy Indicator highlights critical levels of liquidity and market structure shifts.
The model integrates several key components:
- Fair Value Gap (FVG)
- Liquidity Draw
- Market Structure Shift (MSS)
Both time and price are essential factors in making informed trading decisions with this indicator.
You can access the Indicator from this link:
https://tradingfinder.com/products/i...ntry-strategy/
You can access the Indicator on the TradingView website:
https://www.tradingview.com/script/F...etup-For-Life/
Prop Firm DrawDown Protector : Prop Firm Capital Protection Expert MT5 |Forex Money Management: Forex Trade Management Expert MT5 | ICT Concepts Indicator MT5 |Smart Money Concepts Expert MT5 | Smart Money Trap Scanner |Get a free Expert Advisor license via Telegram and WhatsApp
2022 Model ICT Entry Strategy Indicator Specifications
Categories:
- ICT TradingView Indicators
- Smart Money TradingView Indicators
- Liquidity TradingView Indicators
Platforms:
- TradingView
Skill Level:
- Advanced
Indicator Types:
- Reversal Trading Indicators
Timeframe:
- Multi-Timeframe
Trading Style:
- Intraday
Applicable Instruments:
- Forex Markets
- Cryptocurrencies
- Stocks
- Commodities
- Indices
- Forward Trading
- Share Stocks
Indicator Overview
The ICT model strategy is specifically designed for intraday trading. It identifies swing lows and swing highs during major trading sessions such as London and New York.
These identified levels are designated as Liquidity Zones and change color according to market trends:
- Red: Downtrend
- Green: Uptrend
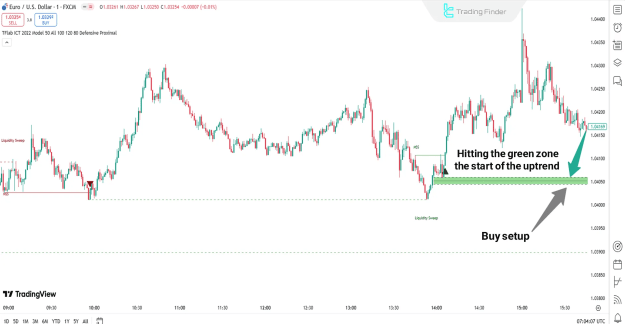
Uptrend Scenario
In a bullish scenario, such as the EUR/USD currency pair, the indicator identifies key liquidity levels, including:
- Previous day’s high and low
- Critical session levels
During this process:
- The price initially moves toward these levels while collecting liquidity (Liquidity Sweep)
- An uptrend is then initiated following a Market Structure Shift (MSS) and a price correction (Green Zone)
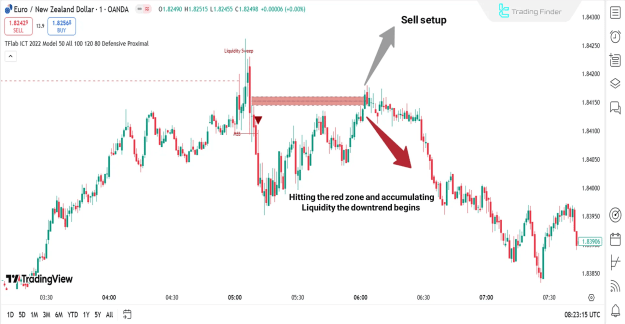
Downtrend Scenario
For a bearish scenario, such as the EUR/NZD pair on the one-minute timeframe:
- Price first collects liquidity at the high level (Liquidity High)
- A downtrend begins following a Market Structure Shift (MSS)
- After this shift, price returns to Premium Zones and Fair Value Gap (FVG), triggering a Sell trade
The indicator effectively visualizes downtrend patterns and liquidity events on the chart.
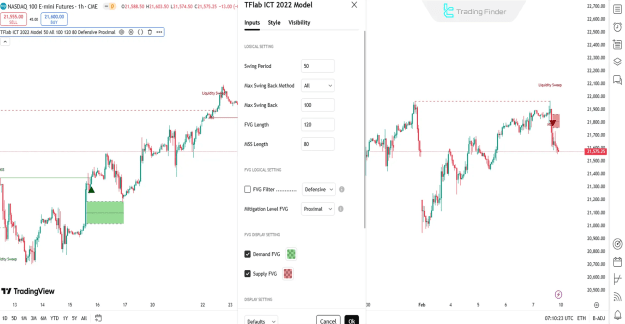
Indicator Settings
The 2022 Model ICT Entry Strategy Indicator includes a detailed settings panel to customize analysis:
Logical Settings:
- Swing Period: Defines the swing period
- Max Swing Back Method: Determines the method for maximum swing back
- Max Swing Back: Sets the maximum swing back distance
- FVG Length: Specifies the length of Fair Value Gap
- MSS Length: Defines the Market Structure Shift length
FVG Logical Settings:
- FVG Filter: Applies a filter to Fair Value Gaps
- Mitigation Level FVG: Sets the mitigation level for FVG
Conclusion
The 2022 Model ICT Entry Strategy Indicator is a TradingView liquidity and imbalance tool designed to identify structural market changes. By leveraging FVG, Liquidity Sweep, and MSS concepts, traders gain a robust framework for intraday trading in Forex, cryptocurrency, and stock markets.