You can access the Indicator from this link:
https://tradingfinder.com/products/i...twitter-model/
You can access the Indicator on the TradingView website:
https://www.tradingview.com/script/0...G-M15-MSS-SMT/
Prop Firm DrawDown Protector : Prop Firm Capital Protection Expert MT4 | Forex Money Management: Forex Trade Management Expert MT4 |ICT Concepts Indicator MT4 | Smart Money Concepts Expert MT4| Smart Money Trap Scanner | Get a free Expert Advisor license via Telegram and WhatsApp
Key Features of the Twitter Model ICT Indicator
- Dual-Direction Functionality – Operates effectively in both bullish and bearish market conditions.
- ICT-Based Analysis – Implements ICT concepts such as CISD (Change in State of Delivery) to validate trade entries.
- Liquidity Zone Detection – Tracks the Previous Day’s High (PDH) and Previous Day’s Low (PDL) to identify liquidity sweeps.
- Fair Value Gap (FVG) Integration – Highlights premium entry opportunities based on price imbalances.
- Intraday Precision – Optimized for short-term timeframes ranging from 1 minute to 4 hours.
- Multi-Market Compatibility – Works seamlessly in forex, cryptocurrency, and other highly liquid markets.
Trading Strategy Overview
The Twitter Model ICT Indicator is a liquidity-based system that evaluates price movements relative to PDH and PDL.
By combining liquidity sweep detection with the Fair Value Gap (FVG) concept, it improves trade timing, enhances accuracy, and strengthens market structure analysis.
This integrated approach makes it a powerful tool for traders focused on liquidity zones and short-term precision strategies.
Example Trade Setups
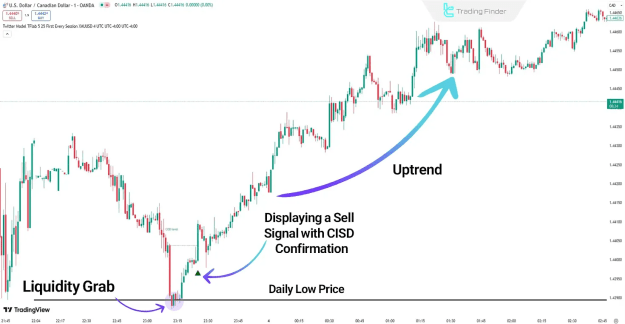
![]() Bullish Setup (USD/CAD, 1-Minute Chart)
Bullish Setup (USD/CAD, 1-Minute Chart)
- Liquidity is collected below the Previous Day’s Low (PDL).
- Price reclaims the daily range, triggering a buy entry after CISD confirmation.
- Market structure shifts upward, confirming bullish momentum.
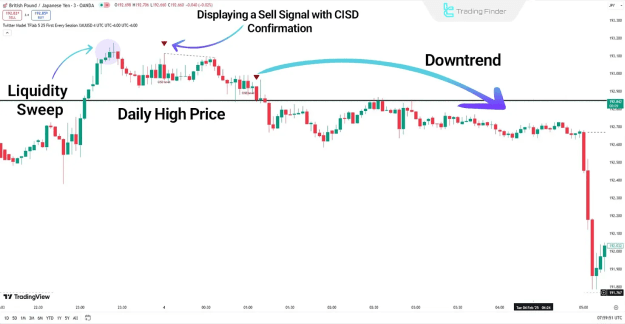
![]() Bearish Setup (GBP/JPY, Downtrend)
Bearish Setup (GBP/JPY, Downtrend)
- Liquidity is absorbed above the Previous Day’s High (PDH).
- Price re-enters the daily range, generating a sell entry upon CISD confirmation.
- Structure aligns with bearish continuation.
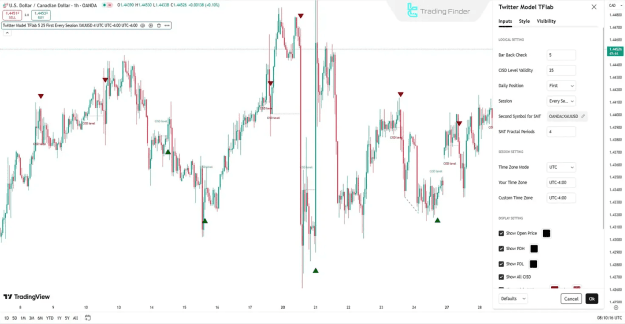
Customization and Settings
Logical Settings
- Bar Back Check – Defines the number of previous candlesticks used to validate CISD.
- CISD Level Validity – Duration a CISD level remains active.
- Daily Position – Aligns trade direction with daily bias.
- Session – Selects active trading session.
- Second Symbol for SMT – Enables divergence comparison with another asset.
- SMT Fractal Periods – Sets fractal count for SMT analysis.
Session Settings
- Time Zone Mode – Adjusts automatically or uses custom time zone.
- Your Time Zone – Sets the default trading zone.
- Custom Time Zone – Configures sessions for specific regions.
Display Settings
- Show Open Price – Displays the daily open level.
- Show PDH/PDL – Marks the previous day’s high and low.
- Show All CISD – Displays all CISD levels on the chart.
- Show High/Low CISD Names – Labels CISD zones for quick recognition.
- SMT Divergence Display – Enables or disables SMT divergence lines and labels.
Conclusion
The Twitter Model ICT Indicator is a comprehensive solution for precision market analysis.
By integrating Market Structure (MS), Liquidity Zones, Fair Value Gaps, and CISD confirmations, it empowers traders to:
- Detect and capitalize on liquidity grabs.
- Confirm structural market shifts.
- Enter trades with higher confidence in both bullish and bearish conditions.
Its design makes it especially effective for intraday trading and short-term liquidity strategies across forex, crypto, and global markets.