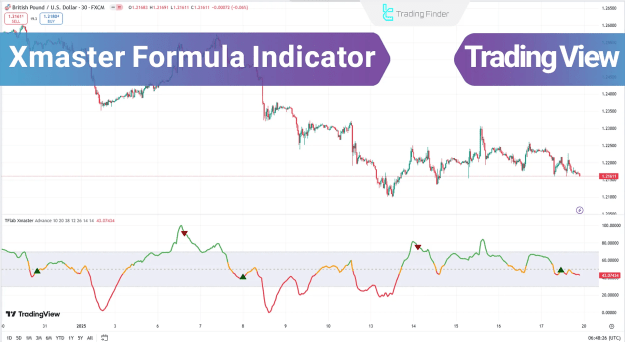
The indicator is distinguished by its dual functionality, offering both a Standard Mode and an Advanced Mode, each tailored to different trading strategies.
You can access the Indicator from this link:
https://tradingfinder.com/products/i...aster-formula/
You can access the Indicator on the TradingView website:
https://www.tradingview.com/script/g...nt-Strategies/
Prop Firm DrawDown Protector : Prop Firm Capital Protection Expert MT4 | Forex Money Management: Forex Trade Management Expert MT4 |ICT Concepts Indicator MT4 | Smart Money Concepts Expert MT4| Smart Money Trap Scanner | Get a free Expert Advisor license via Telegram and WhatsApp
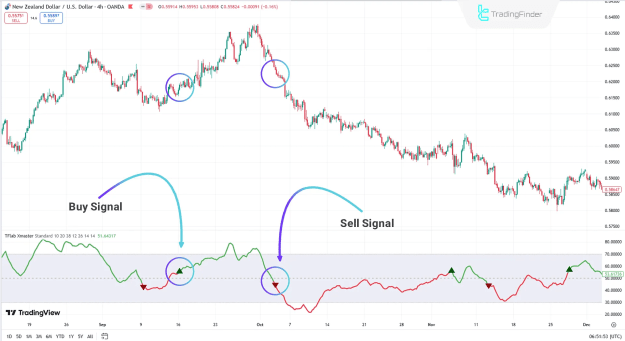
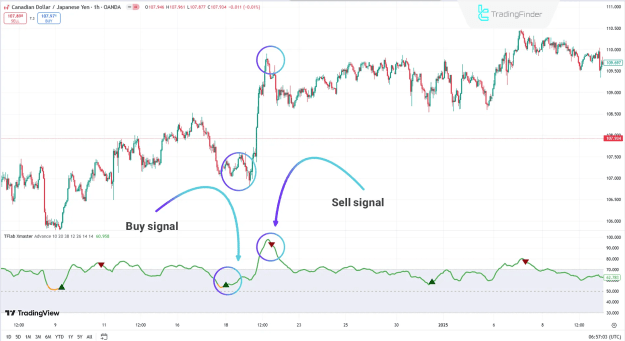
Standard Mode
This mode is ideal for traders who prefer straightforward signals for quick decision-making. It operates on a normalized scale, calculating the difference between a 10-period short-term Exponential Moving Average (EMA) and a 38-period long-term EMA.
- Buy Signal: Generated when the normalized value exceeds 55 and the trendline turns green.
- Sell Signal: Triggered when the normalized value falls below 45 and the trendline turns red.
Advanced Mode
For more robust and detailed analysis, the Advanced Mode combines multiple technical indicators. This approach provides more accurate signals by using a confluence of confirmations.
- MACD: Signals are based on the histogram. A Buy signal occurs when bars are positive, and a Sell signal when they are negative.
- RSI: This oscillator helps identify overbought and oversold conditions. A Buy signal is generated when the RSI falls below 30, while a Sell signal is triggered when it exceeds 70.
- Stochastic Oscillator: Similar to the RSI, the Stochastic Oscillator indicates potential reversals. A Buy signal is active when the value is below 20, and a Sell signal is active when it's above 80.
- Parabolic SAR: This tool is crucial for identifying trend changes and managing risk. A Buy signal is triggered when SAR points are below the price, and a Sell signal when they are above the price.
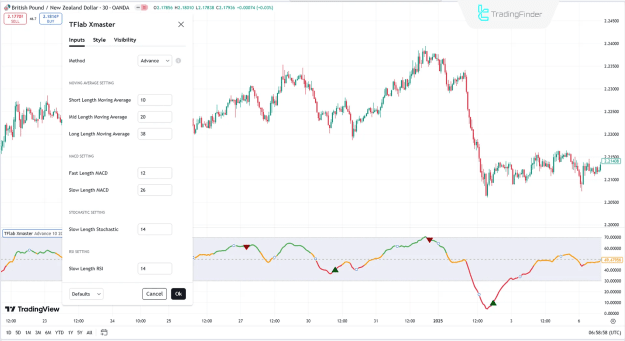
Key Components and Settings
The Xmaster (XHMaster) Formula Indicator utilizes a combination of moving averages and other technical tools to analyze market trends. Traders can customize these settings to align with their specific strategies.
- Moving Averages: The indicator allows for the adjustment of short-term, mid-term, and long-term lengths. These EMAs are fundamental for identifying the overall trend and price movements.
- MACD, RSI, and Stochastic Oscillator: Each of these indicators has configurable settings (e.g., fast and slow lengths for MACD, and slow length for RSI and Stochastic) to fine-tune the signal generation process.
- Parabolic SAR: This component plays a vital role in managing risks by providing insights into potential trend reversals.
Conclusion
The Xmaster (XHMaster) Formula Indicator is a versatile trading tool available on platforms like TradingView. It operates in two modes: the Standard Mode, which uses normalized moving averages for simple, fast signals, and the Advanced Mode, which combines multiple technical indicators like MACD, RSI, Stochastic Oscillator, and Parabolic SAR for more detailed and accurate market analysis. This dual functionality provides traders with precise insights into market trends, reversals, and risk management.