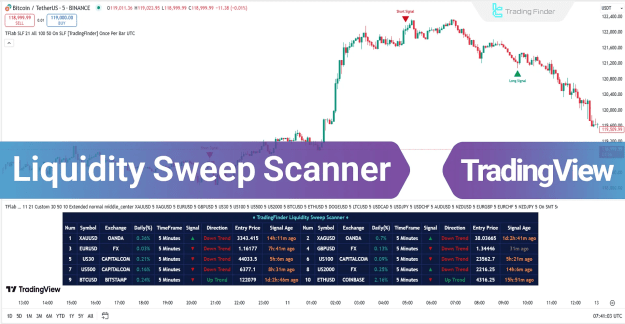
In addition to providing buy and sell signals via green and red arrows, the scanner features a real-time data box for multiple trading symbols. This box displays key information, including:
- Price change percentage
- The selected time frame
- Trend direction
- The current price
- Time elapsed since the last signal
Please note that this scanner is available for a one-time payment of $50. Upon payment, you can contact Trading Finder support via live chat on their website, Telegram, or WhatsApp to receive the activation link.
You can access the Indicator from this link:
https://tradingfinder.com/products/i...sweep-scanner/
You can access the Indicator on the TradingView website:
https://www.tradingview.com/script/l...TradingFinder/
Prop Firm DrawDown Protector : Prop Firm Capital Protection Expert MT5 |Forex Money Management: Forex Trade Management Expert MT5 | ICT Concepts Indicator MT5 |Smart Money Concepts Expert MT5 | Smart Money Trap Scanner |Get a free Expert Advisor license via Telegram and WhatsApp
Liquidity Sweep Scanner Overview
The Liquidity Sweep Scanner is a TradingView indicator that falls into several categories, including:
- ICT Tradingview Indicators
- Smart Money Tradingview Indicators
- Liquidity Tradingview Indicators
Key Features and Supported Instruments
This TradingView indicator is designed for traders with advanced trading skills and supports a multi-timeframe analysis for intraday trading. It can be applied to a wide range of trading instruments, including:
- Forex Market
- Cryptocurrency
- Stocks (including Share Stocks)
- Commodities
- Indices
How the Liquidity Sweep Scanner Works
The Liquidity Sweep Scanner operates on three core components to identify high-probability reversal zones.
1. Identifying Swing Points
The first step is to identify valid market highs (Swing Highs) and lows (Swing Lows). These points are significant because they are often zones where liquidity accumulates and where many traders place their stop-losses, making them crucial for market decisions.
2. Defining the Reaction Zone
The reaction zone is the area between a swing point and the highest or lowest open/close price of the associated candle. This is the area where the price often reacts after an initial breakout, and it frequently dictates the next market direction.
3. Checking for a Liquidity Sweep
This stage involves checking for a price return into the reaction zone that breaks past the swing level. The scanner distinguishes between a genuine breakout and a liquidity sweep, which is essential for filtering out false signals.
4. Identifying the Confirmation Candle
The final component is the presence of a special confirmation candle, such as a Doji or other small-bodied patterns, within the reaction zone. These candles suggest a failed breakout and indicate a high probability of a trend reversal.
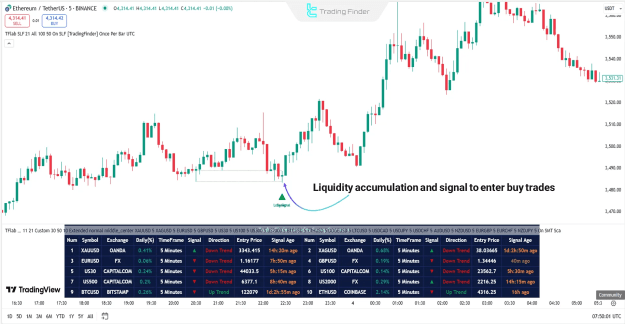
Scanner Behavior in an Uptrend
In an uptrend, the Liquidity Hunt Scanner identifies a valid Swing Low and marks the corresponding reaction zone. After a price correction, the scanner looks for a Liquidity Sweep as the price returns to this zone.
The appearance of a confirmation candle, such as a Doji or a small-bodied candle, signals a false breakout and weakness among sellers. In this scenario, a green arrow will appear, signaling a potential buy entry.
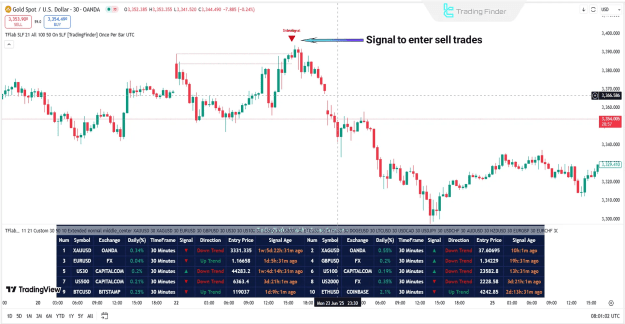
Scanner Behavior in a Downtrend
Conversely, in a downtrend, the scanner identifies a valid Swing High where buyers' liquidity is concentrated. It then marks the reaction zone from this high.
A price return to this zone that briefly breaks above the high but fails to hold indicates buyer weakness. When a confirmation candle, such as a Doji or a bearish candle, closes within this zone, a red arrow appears, signaling a potential sell entry.
Liquidity Sweep Scanner Settings
The Liquidity Sweep Scanner offers a variety of customizable settings to suit individual trading preferences.
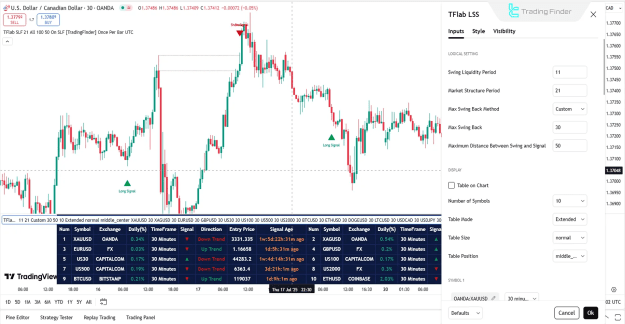
Logical Settings
- Swing Liquidity Period: Defines the period for detecting swing liquidity.
- Market Structure Period: Sets the period for displaying the market structure.
- Max Swing Back Method: Determines the maximum swing-back method.
- Max Swing Back: Specifies the maximum number of swing backs.
- Maximum Distance Between Swing and Signal: Controls the maximum distance between the swing point and the signal.
Display
- Table on Chart: Option to display the data table directly on the chart.
- Number of Symbols: Specifies the number of symbols to be displayed.
- Table Mode: Controls the table display mode.
- Table Size: Allows selecting the size of the table.
- Table Position: Sets the position of the table on the chart.
Symbol
- Symbol 1–20: Allows users to select up to 20 different trading symbols for monitoring. The preferred time frame can be selected from the settings and applies to all symbols.
Alert
- Alert: Option to enable alerts.
- Alert Name: Allows the user to select an alert name.
- Message Frequency: Controls the frequency of alert messages.
- Show Alert Time by Time Zone: Option to display alert times based on a specific time zone.
Conclusion
The Liquidity Sweep Scanner is a powerful trading tool that effectively identifies valid Swing Highs, Swing Lows, reaction zones, and key reversal points. By combining analysis of liquidity data, market structure, and confirmation candles, this indicator filters out false breakouts and helps traders identify low-risk entry opportunities.