You can access the Indicator from this link:
https://tradingfinder.com/products/i...e-of-delivery/
You can access the Indicator on the TradingView website:
https://www.tradingview.com/script/g...r-Liquidity-1/
Prop Firm DrawDown Protector : Prop Firm Capital Protection Expert MT4 | Forex Money Management: Forex Trade Management Expert MT4 |ICT Concepts Indicator MT4 | Smart Money Concepts Expert MT4| Smart Money Trap Scanner | Get a free Expert Advisor license via Telegram and WhatsApp
CISD Indicator Specifications
The Change in State of Delivery (CISD) Indicator is an advanced technical analysis tool designed for traders following ICT and Smart Money Concepts (SMC) frameworks. It combines price action with market structure analysis to detect breakout-driven reversals.
Categories:
- ICT TradingView Indicators
- Smart Money TradingView Indicators
- Signal & Forecast TradingView Indicators
Platform: TradingView
Skill Level: Advanced
Indicator Type: Reversal Indicator
Timeframe Suitability: Multi-Timeframe
Trading Style: Intraday
Markets:
- Forex
- Cryptocurrencies
- Forward Contracts
Overview of the CISD Indicator
The CISD is a hybrid trading indicator that incorporates the Swing Failure Pattern (SFP) to detect liquidity zones and reversal points. It analyzes the last four candlesticks involved in a price swing and liquidity grab. Once liquidity is absorbed, the indicator marks the CISD level and anticipates a breakout, signaling a potential reversal.
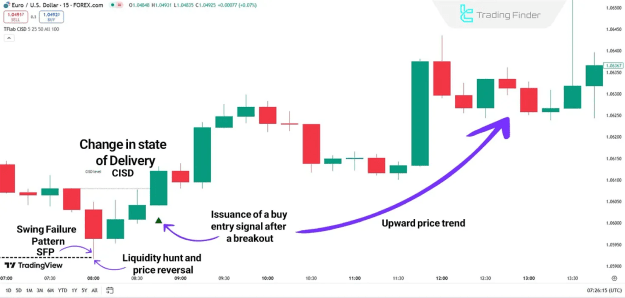
CISD in an Uptrend
To identify a bullish CISD, traders first look for liquidity zones. For example, in a EUR/USD chart, price may tap into liquidity, form an SFP, and then reverse upward. After liquidity absorption, a CISD breakout occurs, and the indicator plots a green arrow, signaling a long opportunity.
Key Features:
- Detects liquidity grabs through SFP
- Confirms reversal with CISD breakout
- Displays buy signals with green arrows
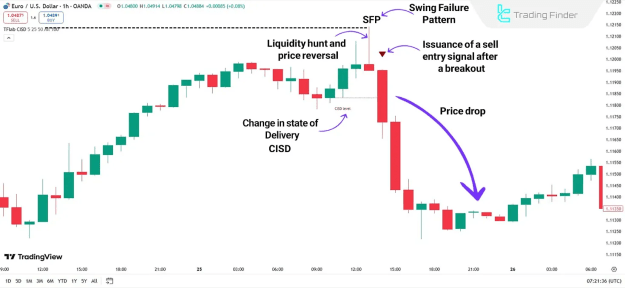
CISD in a Downtrend
In bearish conditions, price often creates false breakouts into liquidity zones before reversing lower. Once a CISD breakout forms, the indicator plots a red arrow, signaling a short opportunity.
Key Features:
- Identifies liquidity captures in rising markets
- Confirms reversal via bearish CISD breakout
- Displays sell signals with red arrows
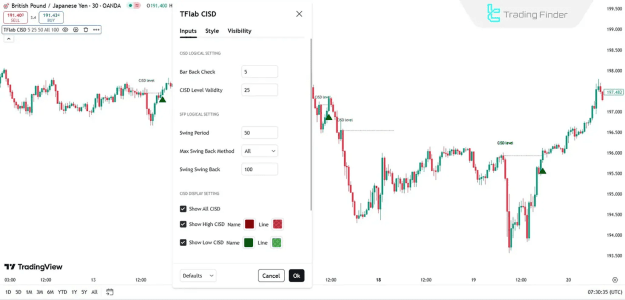
CISD Indicator Settings
The CISD provides a variety of customizable settings, allowing traders to adjust both logic and visualization according to their strategy.
CISD Logical Settings
- Bar Back Check – Analyzes prior candlesticks to validate structure
- CISD Level Validity – Confirms the integrity of CISD zones before signaling
SFP Logical Settings
- Swing Period – Defines the timeframe for significant swings
- Max Swing Back Method – Detects maximum retracements to confirm trend direction
CISD Display Settings
- Swing Back – Evaluates pullbacks to measure trend strength
- Show All CISD – Displays all CISD zones on the chart
- Show High CISD Name – Marks bullish CISD zones in green
- Show Low CISD Name – Marks bearish CISD zones in red
SFP Display Settings
- Show All SFP – Option to visualize all Swing Failure Patterns (disabled by default)
- Show High SFP Name – Displays SFPs at higher price zones
- Show Low SFP Name – Displays SFPs at lower price zones
Conclusion
The Change in State of Delivery (CISD) Indicator is a sophisticated reversal detection tool built for advanced traders. By integrating liquidity grabs (SFP) with market structure breakouts, it highlights high-probability entry points across Forex, crypto, and forward markets.
Its ability to capture liquidity events, mark CISD zones, and generate clear buy/sell signals makes it a valuable addition to ICT- and SMC-based strategies. The CISD empowers traders to improve timing, refine execution, and trade reversals with greater confidence