The indicator plots divergences directly on the chart with clear color-coded lines and markers, while a real-time information table provides detailed divergence statistics to support faster, more informed trading decisions.
You can access the Indicator from this link:
https://tradingfinder.com/products/i...me-divergence/
You can access the Indicator on the TradingView website:
https://www.tradingview.com/script/b...-Vol-Reversal/
Prop Firm DrawDown Protector : Prop Firm Capital Protection Expert MT5 |Forex Money Management: Forex Trade Management Expert MT5 | ICT Concepts Indicator MT5 |Smart Money Concepts Expert MT5 | Smart Money Trap Scanner |Get a free Expert Advisor license via Telegram and WhatsAp
Key Features of the OBV Divergence Indicator
The OBV Divergence Indicator is designed for traders who want a reliable way to spot momentum discrepancies between price action and the On Balance Volume (OBV) indicator. It combines visual signals with data-driven insights, helping traders identify potential reversals and improve execution accuracy.
Core Functionalities
- Real-time detection of bullish and bearish divergences between price and OBV
- Color-coded signals: green lines for bullish divergence, red lines for bearish divergence
- Comprehensive on-chart table showing divergence quality, frequency, and status
- Multi-timeframe compatibility for deeper confirmation across chart levels
- Versatility across markets: Forex, cryptocurrencies, stocks, indices, and commodities
Indicator Classification and Application
- Categories:
- Signal & Forecast TradingView Indicators
- Currency Strength TradingView Indicators
- Trading Assist Tools
- Platform: TradingView
- User Skill Level: Intermediate
- Indicator Type: Reversal Indicator
- Timeframe Compatibility: Multi-Timeframe
- Trading Style: Intraday
- Market Suitability:
- Forex
- Cryptocurrencies
- Stocks
- Commodities
- Indices
- Share Markets
Indicator Display and Functionality
Real-Time Divergence Table
The indicator features an on-chart table that provides detailed divergence metrics, including:
- Type Divergence – Bullish or bearish signal
- Exist – Confirms current divergence with a “+” symbol
- Consecutive – Number of back-to-back divergences detected
- Divergence Quality – Strength rating based on consistency
- Change Phase – Highlights transitions between OBV peaks and troughs
This data-driven approach helps traders validate signals and time their trades with greater precision.
Divergence Scenarios
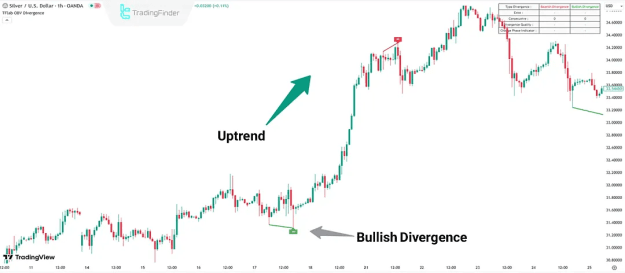
Bullish Divergence
- Occurs when OBV rises while price forms a lower low
- A green line is plotted, signaling bullish divergence
- Suggests rising buying pressure and potential upside reversal
- Confirmation of momentum shift strengthens the buy signal
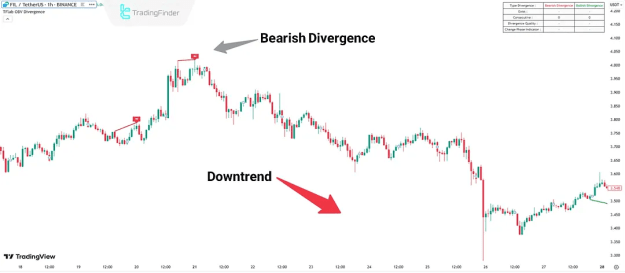
Bearish Divergence
- Occurs when OBV declines while price makes a higher high
- A red line is plotted, signaling bearish divergence
- Suggests weakening demand and possible downtrend initiation
- Often used as a sell trigger when aligned with price action
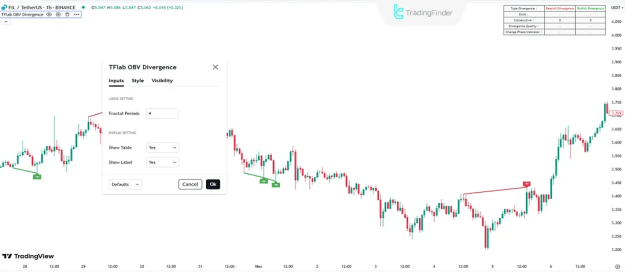
Indicator Settings
Logical Settings
- Fractal Period – Defines the number of bars used to detect divergences (Default: 4)
Display Settings
- Show Table – Enables or disables the divergence statistics table
- Show Label – Displays divergence type and location directly on the chart
These flexible options allow traders to adapt the indicator to their preferred chart setup and trading style.
Conclusion
The OBV Divergence Indicator is a volume-based analysis tool that helps traders identify reversal opportunities across multiple asset classes. By comparing shifts in OBV against price action, it pinpoints areas of imbalance where market trends are likely to change.
Its ability to detect both bullish and bearish divergences, combined with a real-time statistics table and multi-asset compatibility, makes it a valuable addition to any trading strategy. Whether used in Forex, crypto, stocks, or commodities, it enhances precision, supports better timing, and boosts confidence in both intraday and swing trading approaches.