By displaying dashed lines on the chart, the Liquidity Finder Indicator visually represents these liquidity zones, giving traders a clear edge in anticipating stop hunts and potential trend reversals.
You can access the Indicator from this link:
https://tradingfinder.com/products/i...uidity-finder/
You can access the Indicator on the TradingView website:
https://www.tradingview.com/script/K...uidity-Finder/
Prop Firm DrawDown Protector : Prop Firm Capital Protection Expert MT5 |Forex Money Management: Forex Trade Management Expert MT5 | ICT Concepts Indicator MT5 |Smart Money Concepts Expert MT5 | Smart Money Trap Scanner |Get a free Expert Advisor license via Telegram and WhatsAp
Key Features of the Liquidity Finder Indicator
The main specifications and trading characteristics of this indicator include:
- Indicator Categories: ICT TradingView Indicators, Smart Money TradingView Indicators, Liquidity TradingView Indicators
- Platforms: TradingView Indicators
- Trading Skills Required: Advanced
- Indicator Types: Reversal TradingView Indicators
- Timeframe: Multi-Timeframe TradingView Indicators
- Trading Styles: Intraday TradingView Indicators
- Applicable Markets:
- Forex TradingView Indicators
- Cryptocurrency TradingView Indicators
- Stock TradingView Indicators
- Commodity TradingView Indicators
- Forward TradingView Indicators
- Share Stocks TradingView Indicators
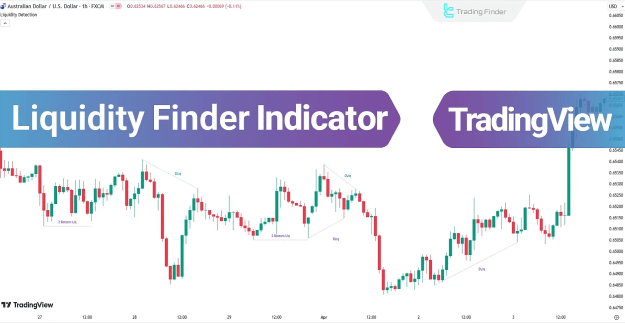
Liquidity Finder Indicator at a Glance
Liquidity accumulation zones are commonly located:
- Above double top or triple top patterns
- Below double bottom or triple bottom patterns
- Above bearish trend lines
- Below bullish trend lines
These liquidity pools represent areas where stop losses are triggered, often followed by sharp price movements driven by institutional activity.
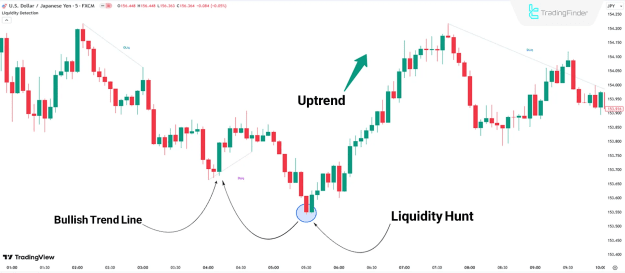
Liquidity Zones in an Uptrend
In an uptrend, liquidity zones typically form below bullish trend lines.
- Example: In the USD/JPY chart, the Liquidity Finder Indicator highlights zones under bullish support lines.
- Once liquidity is hunted in these areas, the price often reverses upward, continuing the dominant bullish trend.
Uptrend Analysis
This illustrates how liquidity sweeps in bullish conditions provide opportunities to align with institutional order flow.
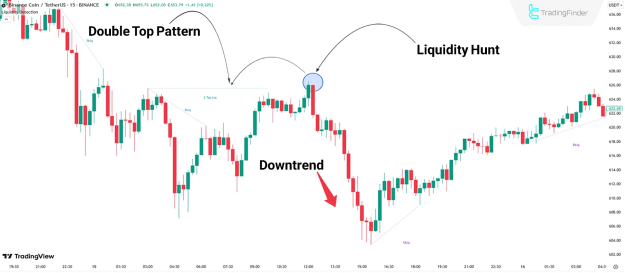
Liquidity Zones in a Downtrend
In a bearish market, liquidity is frequently built above key resistance levels or double tops.
- Example: On the BNB 15-minute chart, the indicator marks liquidity above a double top using blue dashed lines.
- When the price sweeps this liquidity, it often triggers a downward reversal.
Downtrend Analysis
These scenarios demonstrate how liquidity hunts above resistance signal institutional manipulation before a bearish continuation.
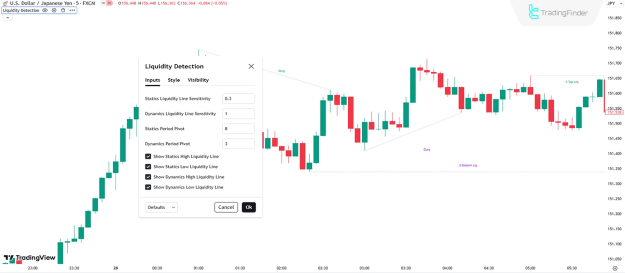
Indicator Settings
The recommended default settings for the Liquidity Finder Indicator include:
- Static Liquidity Line Sensitivity: 0.3
- Dynamic Liquidity Line Sensitivity: 1
- Static Period Pivot: 8
- Dynamic Period Pivot: 3
- Show Static High Liquidity Line: Enabled
- Show Static Low Liquidity Line: Enabled
- Show Dynamic High Liquidity Line: Enabled
- Show Dynamic Low Liquidity Line: Enabled
Conclusion
The Liquidity Finder Indicator is a powerful TradingView tool for identifying liquidity pools created around double tops, double bottoms, bearish trend lines, and bullish trend lines. By marking these areas with dashed lines, traders can anticipate stop loss hunts and potential trend reversals.
As part of the ICT trading framework and Smart Money Concepts (SMC), this indicator offers traders valuable insight into institutional price action, making it a highly effective resource for advanced intraday strategies.