During this period, the Judas Move occurs, and a CISD level break between 08:30 and 08:45 AM defines the prevailing trend conditions. By recognizing deceptive price movements and avoiding market maker traps, this indicator enhances the accuracy of trade entries.
This tool leverages liquidity concepts to highlight false moves while providing better opportunities to capture genuine trends.
You can access the Indicator from this link:
https://tradingfinder.com/products/i...wing-setup-03/
You can access the Indicator on the TradingView website:
https://www.tradingview.com/script/m...0am-CHoCH-FVG/
Prop Firm DrawDown Protector : Prop Firm Capital Protection Expert MT5 |Forex Money Management: Forex Trade Management Expert MT5 | ICT Concepts Indicator MT5 |Smart Money Concepts Expert MT5 | Smart Money Trap Scanner | Get a free Expert Advisor license via Telegram and WhatsApp
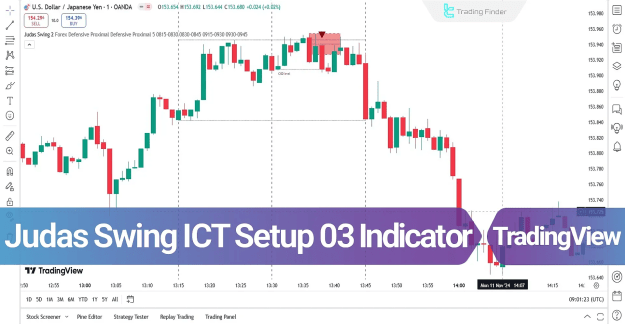
Judas Swing Indicator Specifications
Indicator Categories:
- ICT TradingView Indicators
- Smart Money TradingView Indicators
- Signal & Forecast TradingView Indicators
Platforms: TradingView
Skill Level: Advanced
Indicator Types: Reversal
Timeframe: M1–M5
Trading Style: Scalping, Fast Scalping
Markets: Forex, Cryptocurrency, Stocks
Overview of the Indicator
The Judas process applies to both Forex and stock markets but occurs at distinct time intervals. Initially, highs and lows are identified during 09:15 to 09:30 AM (stock market). Then, in 09:30 to 09:45 AM, the Judas Move occurs, and the CISD level break determines trend conditions.
By analyzing liquidity, the indicator highlights fake price moves and provides signals to capture genuine market trends.
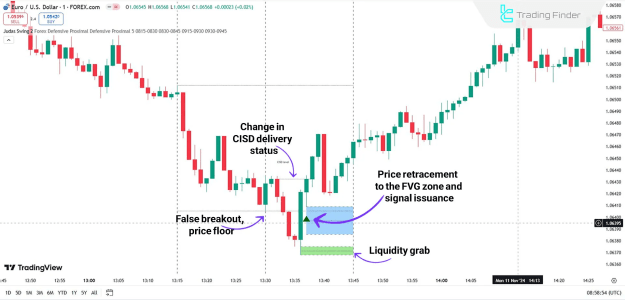
Indicator in an Uptrend
- On the EUR/USD 1-minute chart, the price breaks a low drawn by the indicator with a deceptive move.
- Key zones, including Order Blocks and Fair Value Gaps (FVG), are identified.
- Price absorbs liquidity from these zones, triggering a Change of Character (CHoCH), which signals the start of an uptrend.
- The indicator generates a buy entry signal for traders.
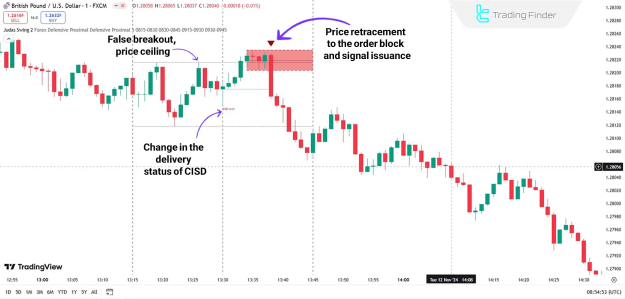
Indicator in a Downtrend
- On the GBP/USD 1-minute chart, a false breakout occurs above a high drawn by the indicator.
- After retracing to the Order Block zone and collecting liquidity, a CHoCH confirms the start of a downtrend.
- The indicator issues a sell signal, allowing traders to capitalize on bearish momentum.
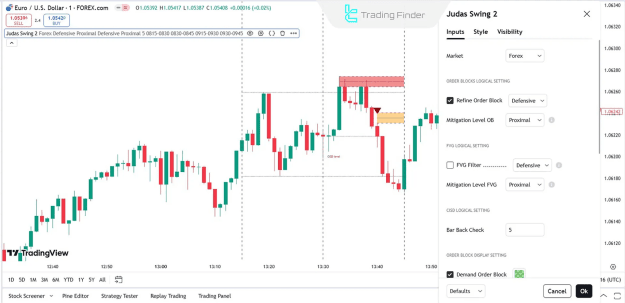
Judas Swing Indicator Settings
- Market Selection: Choose Forex or Stocks.
- Order Block Settings:
- Refine Order Blocks for higher precision
- Mitigation Level for closer Order Block zones
- FVG Settings:
- Filter Fair Value Gap zones
- Mitigation Level for closer FVG zones
- CISD Settings:
- Bar Back Check for last 5 candles (default)
- Display Settings:
- Demand/Supply Order Blocks (green/red)
- Demand/Supply FVG zones (green/red)
- Highlight high/low CISD levels (red/green)
- Market Opening Range:
- Forex: 08:15–08:30 (Opening), 08:30–08:45 (Analysis)
- Stocks: 09:15–09:30 (Opening), 09:30–09:45 (Analysis)
Conclusion
The Judas Swing ICT Setup 03 Indicator focuses on identifying deceptive price moves and analyzing liquidity zones, helping traders avoid false entries. By evaluating Order Blocks and FVG during specific time intervals, this tool provides accurate entry and exit signals for both Forex and stock markets.