This pattern comprises five essential points: X, A, B, C, and D. The indicator emphasizes Point D as the pivotal element within this formation, given its substantial likelihood of signaling a price reversal in the Potential Reversal Zone (PRZ).
You can access the Indicator from this link:
https://tradingfinder.com/products/i...monic-pattern/
You can access the Indicator on the TradingView website:
https://www.tradingview.com/script/k...onic-Detector/
Prop Firm DrawDown Protector : Prop Firm Capital Protection Expert MT5 |Forex Money Management: Forex Trade Management Expert MT5 | ICT Concepts Indicator MT5 |Smart Money Concepts Expert MT5 | Smart Money Trap Scanner | Get a free Expert Advisor license via Telegram and WhatsApp
Specifications for the Butterfly Pattern Indicator
The following outlines the key specifications of the indicator:
- Indicator Categories:
- Signal & Forecast TradingView Indicators
- Harmonic TradingView Indicators
- Chart & Classic TradingView Indicators
- Platforms:
- TradingView Indicators
- Trading Skills:
- Intermediate
- Indicator Types:
- Reversal TradingView Indicators
- Timeframe:
- Multi-Timeframe TradingView Indicators
- Trading Style:
- Day Trading TradingView Indicators
- Trading Instruments:
- TradingView Indicators in the Forex Market
- Cryptocurrency TradingView Indicators
- Stock TradingView Indicators
- Forward TradingView Indicators
- Share Stocks TradingView Indicators
Overview of the Indicator
Each point within the Butterfly Harmonic Pattern fulfills a distinct function in its structural analysis. Point X establishes the pattern's origin and serves as the foundation for Fibonacci ratio computations. The segment from X to A denotes an initial price impulse, often manifesting as a directional trend. Point B signifies a retracement of the XA leg, commonly aligning with the 0.618 Fibonacci level.
Subsequently, Point C extends the price action further. Ultimately, Point D emerges as the most significant juncture, delineating the Potential Reversal Zone (PRZ).
Indicators in Bullish Trends
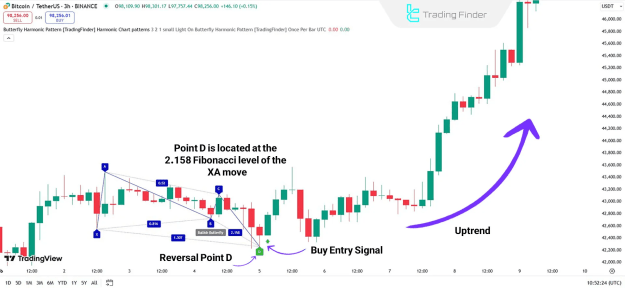
In the 3-hour chart of Bitcoin (BTC), the bullish Butterfly Harmonic Pattern concludes upon the price attaining Point D within the Potential Reversal Zone (PRZ).
At this juncture, the price initiates an ascending trend, characterized by successive higher highs and higher lows. The indicator concurrently generates a buy signal.
Indicators in Bearish Trends
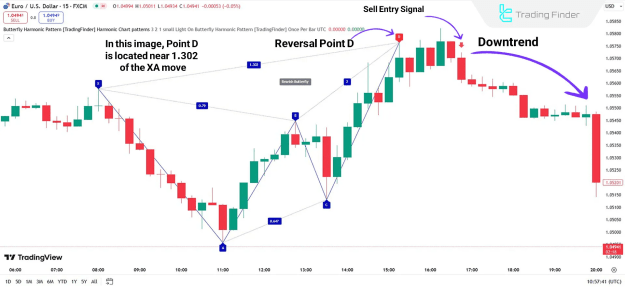
Within the downtrend of the EUR/USD currency pair, the critical points X, A, B, C, and D are delineated. Following the arrival at Point D, designated as the Potential Reversal Zone (PRZ), the BC segment retraces approximately 0.647 of the AB leg.
Upon the establishment of Point D, the price commences a descending trend, producing consistent lower highs and lower lows. During this phase, the indicator presents a sell signal.
Indicator Settings
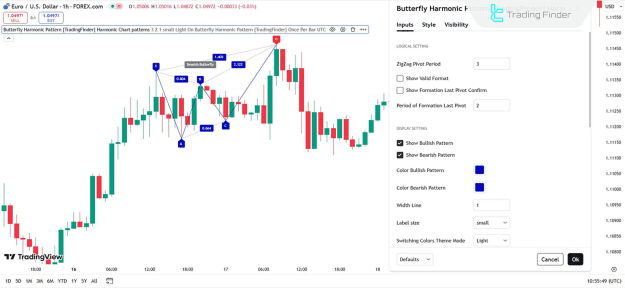
The accompanying image illustrates the full configuration options for the Butterfly Harmonic Indicator, encompassing Logical Settings, Display Settings, and Alerts.
Logical Settings
- ZigZag Pivot Period: Default value is 3.
- Show Valid Format: Displays solely valid patterns.
- Show Formation Last Pivot Confirm: Exhibits confirmation for the final pivot.
- Period of Formation Pivot: Default value is 2.
Display Settings
- Show Bullish Pattern: Enables visibility of bullish patterns.
- Show Bearish Pattern: Enables visibility of bearish patterns.
- Color Bullish Pattern: Default color is blue.
- Color Bearish Pattern: Default color is blue.
- Width Line: Default line thickness is 1.
- Label Size: Permits adjustment of label text size.
- Switching Colors Theme Mode: Facilitates adaptation to the chart background theme.
Alerts
- Alert: Activates notifications upon pattern detection.
- Alert Name: Allows customization of the alert designation.
- Message Frequency: Defines the content of alert messages.
- Show Alert Time by Time Zone: Presents alert timestamps according to the selected time zone.
Conclusion
Upon the completion of Point D as the Potential Reversal Zone (PRZ), the price embarks on a new directional trend, which may proceed either upward or downward.
This Chart & Classic indicator is tailored for traders seeking to identify price reversal zones and initiate positions with reduced risk exposure. The Fibonacci ratios embedded in this pattern are meticulously aligned to discern price dynamics and reversal opportunities intelligently.