Such patterns frequently signal potential market trend reversals. Traders can utilize this indicator to pinpoint reversal points and execute counter-trend strategies effectively.
You can access the Indicator from this link:
https://tradingfinder.com/products/i...lse-breakouts/
You can access the Indicator on the TradingView website:
https://www.tradingview.com/script/F...kouts-Failure/
Prop Firm DrawDown Protector : Prop Firm Capital Protection Expert MT5 |Forex Money Management: Forex Trade Management Expert MT5 | ICT Concepts Indicator MT5 |Smart Money Concepts Expert MT5 | Smart Money Trap Scanner | Get a free Expert Advisor license via Telegram and WhatsApp
False Breakouts Indicator Specifications
This section offers a detailed overview of the indicator's key attributes.
- Indicator Categories:
- ICT TradingView Indicators
- Support & Resistance TradingView Indicators
- Signal & Forecast TradingView Indicators
- Platforms:
- TradingView Indicators
- Trading Skills:
- Advanced
- Indicator Types:
- Reversal TradingView Indicators
- Breakout TradingView Indicators
- Timeframe:
- Multi-Timeframe TradingView Indicators
- Trading Style:
- Day Trading TradingView Indicators
- Trading Instruments:
- TradingView Indicators in the Forex Market
- Cryptocurrency TradingView Indicators
- Stock TradingView Indicators
Indicator Overview
A false breakout occurs when the price momentarily breaks out of a range but fails to sustain the move, reverting to its prior boundaries. This phenomenon often arises from psychological pressures on novice traders, leading to hasty entries that trigger stop losses and accumulate liquidity.
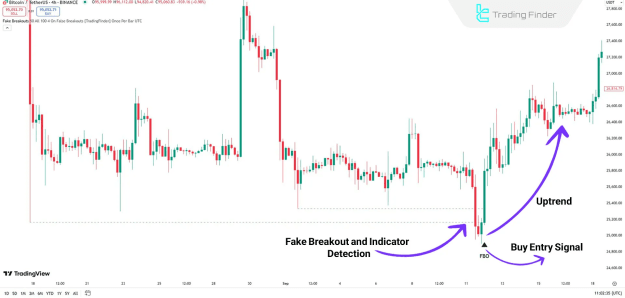
Indicator in an Uptrend
In the provided chart example, Bitcoin (BTC) on a 4-hour timeframe illustrates a case where the price briefly surpasses a resistance level before retreating to its previous range.
This action signifies a false breakout, commonly following the activation of stop orders and liquidity absorption. Consequently, the indicator generates a Buy Entry Signal, represented by a green arrow.
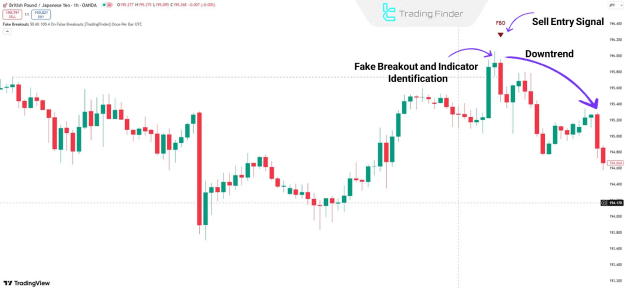
Indicator in a Downtrend
On the 1-hour chart for the GBP/JPY currency pair, the price temporarily violates a support level but swiftly rebounds into its earlier range.
This pattern denotes a false breakout, prompting the indicator to issue a Sell Entry Signal via a red arrow.
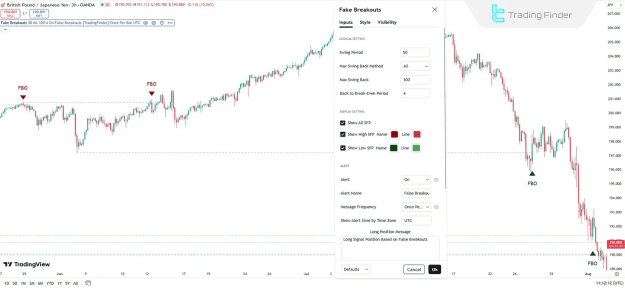
Indicator Settings
The comprehensive configuration options for the False Breakouts Indicator are depicted in the accompanying image. These settings encompass Logical Settings, Display Settings, and Alerts.
Logical Settings
- Swing Period: Defines the period for swing calculations (default: 50).
- Max Swing Back Method: Determines the approach for identifying the maximum swing back.
- Max Swing Back: Specifies the maximum swing back value.
- Back to Breakeven Period: Sets the timeframe for returning to the range (default: 4).
Display Settings
- Show All SFP: Enables the display of all false breakouts.
- Show High SFP: Highlights breakouts above high levels in red.
- Show Low SFP: Displays breakouts below low levels in green.
Alerts
- Alert: Activates notifications upon pattern detection.
- Alert Name: Allows customization of the alert designation.
- Message Frequency: Adjusts the content of alert messages.
- Show Alert Time by Time Zone: Presents alert timestamps based on the chosen time zone.
Conclusion
False breakouts represent a fundamental concept in technical analysis, serving as robust mechanisms for recognizing abrupt price shifts and capitalizing on them in trading activities.
By comprehending this dynamic and integrating the associated indicator, traders can enhance their performance across financial markets while mitigating risks of substantial losses.