This harmonic pattern often appears within the first and second waves of Elliott Wave Theory, where:
- The XA wave corresponds to Wave 1.
- The ABCD correction represents Wave 2.
Each point in the Gartley formation aligns with precise Fibonacci ratios, enabling traders to anticipate potential market turning points.
You can access the Indicator from this link:
https://tradingfinder.com/products/i...monic-pattern/
You can access the Indicator on the TradingView website:
https://www.tradingview.com/script/K...hart-patterns/
Prop Firm DrawDown Protector : Prop Firm Capital Protection Expert MT5 |Forex Money Management: Forex Trade Management Expert MT5 | ICT Concepts Indicator MT5 |Smart Money Concepts Expert MT5 | Smart Money Trap Scanner |Get a free Expert Advisor license via Telegram and WhatsApp
Specifications of the Gartley Harmonic Pattern Indicator
- Indicator Categories:
- Signal & Forecast TradingView Indicators
- Harmonic TradingView Indicators
- Chart & Classic TradingView Indicators
- Platforms:
- TradingView Indicators
- Skill Level Required:
- Intermediate
- Indicator Type:
- Reversal TradingView Indicators
- Timeframe:
- Multi-Timeframe TradingView Indicators
- Trading Style:
- Intraday TradingView Indicators
- Applicable Instruments:
- Forex TradingView Indicators
- Cryptocurrency TradingView Indicators
- Stock TradingView Indicators
- Share Market TradingView Indicators
Structure of the Gartley Pattern
The Gartley formation consists of four main points, each contributing to the identification of the pattern and the forecast of price movements:
- Point X: The starting point of the price movement and the basis for all measurements.
- Point A: Marks the end of the initial movement (XA wave).
- Point B: A corrective move retracing approximately 61.8% of XA.
- Point C: Corrects the AB wave, typically between the 38% and 79% Fibonacci levels.
- Point D: Final point of the correction, generally between 113% and 162% of the BC wave.
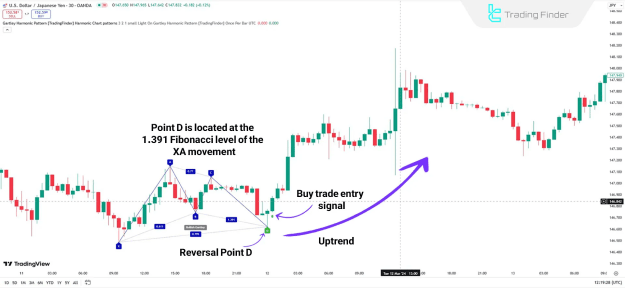
Identifying the Gartley Pattern in an Uptrend
- Movement from X to A: Upward.
- Movement from A to B: Downward retracement.
- Movement from B to C: Upward correction.
- Movement from C to D: Downward leg completing the pattern.
The completed bullish Gartley resembles an "M" shape on the chart. After point D is reached, the price often rises, with the indicator generating a green arrow buy signal.
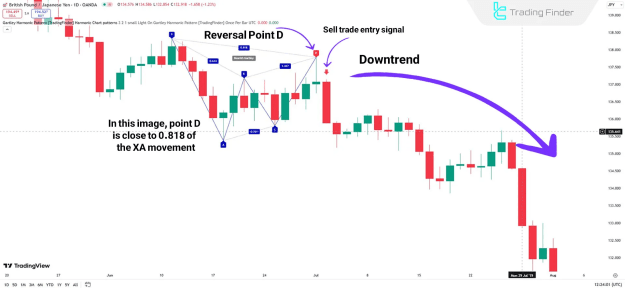
Identifying the Gartley Pattern in a Downtrend
- Movement from X to A: Downward.
- Movement from A to B: Upward retracement.
- Movement from B to C: Downward correction.
- Movement from C to D: Upward move completing the pattern.
The bearish Gartley typically forms a "W" shape on the chart. After point D, prices often decline, with the indicator generating a sell signal.
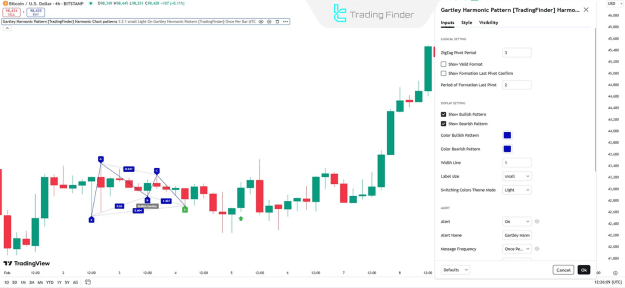
Gartley Harmonic Pattern Indicator Settings
Logical Settings
- ZigZag Pivot Period: Default value is 3.
- Show Valid Format: Display only valid harmonic formations.
- Confirm Last Pivot: Enable final pivot confirmation.
Display Settings
- Formation Pivot Period: Default value is 2.
- Show Bullish Patterns: Enabled by default.
- Show Bearish Patterns: Enabled by default.
- Bullish Pattern Color: Blue.
- Bearish Pattern Color: Red.
- Line Width: Default thickness is 1.
- Label Size: Adjustable.
- Theme Mode: Supports light/dark background modes.
Alert Settings
- Enable Alerts: On pattern completion.
- Alert Name: Customizable.
- Message Frequency: Adjustable.
- Show Alert Time by Time Zone: Enabled for accurate timing.
Conclusion
The Gartley Harmonic Pattern Indicator combines price structure analysis with Fibonacci ratio measurements to detect high-probability market reversal zones. Mastery of this tool requires:
- A strong understanding of technical analysis.
- Risk management skills.
- Practical trading experience.
When applied effectively, it can provide precise trade entry and exit points in forex, cryptocurrency, and stock markets.