This indicator autonomously detects bullish and bearish divergences through lines presented in a dedicated panel external to the price chart.
It assumes a critical function in pinpointing reversal points and alterations in price dynamics. Moreover, this trading instrument compiles divergence data within a distinct table.
You can access the Indicator from this link:
https://tradingfinder.com/products/i...r-rsi-macd-ao/
You can access the Indicator on the TradingView website:
https://www.tradingview.com/script/2...AO-Oscillator/
Prop Firm DrawDown Protector : Prop Firm Capital Protection Expert MT4 | Forex Money Management: Forex Trade Management Expert MT4 |ICT Concepts Indicator MT4 | Smart Money Concepts Expert MT4| Smart Money Trap Scanner | Get a free Expert Advisor license via Telegram and WhatsApp
Divergence Detector Indicator (MACD, RSI, or AO) Specifications
The attributes of the Divergence Detector Indicator (MACD, RSI, or AO) are detailed as follows:
Indicator Categories
- Oscillators Tradingview Indicators
- Signal & Forecast Tradingview Indicators
- Trading Assist Tradingview Indicators
Platforms
- Trading View Indicators
Trading Skills
- Intermediate
Indicator Types
- Reversal Tradingview Indicators
Timeframe
- Multi-Timeframe Tradingview Indicators
Trading Style
- Intraday Tradingview Indicators
- Swing Trading Tradingview Indicators
Trading Instruments
- TradingView Indicators in the Forex Market
- Cryptocurrency Tradingview Indicators
- Stock Tradingview Indicators
Indicator Overview
The Divergence Detector Indicator (MACD, RSI, or AO) presents real-time divergence details in a separate table on the chart. The information encompassed in this table comprises:
- Type Divergence: The divergence classification as Bullish or Bearish;
- Exist: Indicates "+" in the presence of a divergence;
- Consecutive: Denotes the count of successive divergences;
- Divergence Quality: Assesses divergence caliber according to consecutive instances;
- Change Phase Indicator: Identifies phase transitions between oscillating peaks.
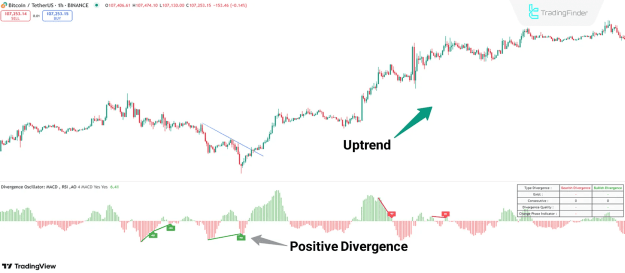
Indicator Performance in an Uptrend
In the Bitcoin (BTC) price chart on a one-hour timeframe, the price established lower highs (LH), whereas the oscillator (MACD Divergence) exhibited higher lows (HL) as bullish divergence.
Bullish divergence may serve as an indication for initiating long positions.
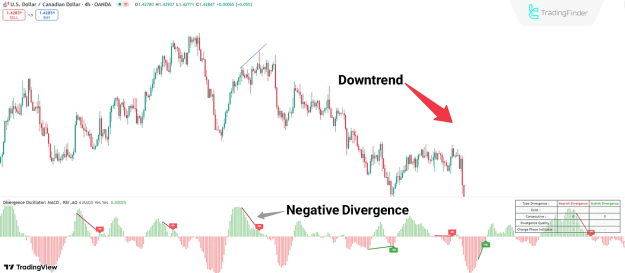
Indicator Performance in a Downtrend
For instance, in the USD/CAD currency pair chart on a four-hour timeframe, the price generated higher highs (HH), while the indicator showed lower highs (LL), signifying bearish divergence.
Bearish divergence denotes the conclusion of an uptrend and the onset of a downtrend.
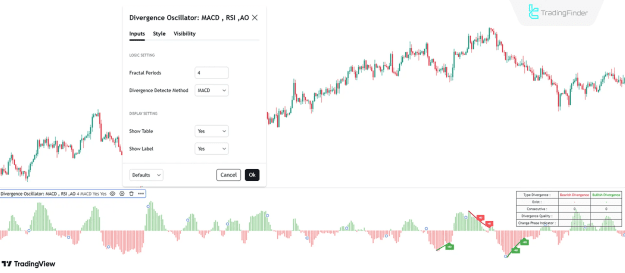
Indicator Settings
The configuration parameters of the Divergence Detector Indicator (MACD, RSI, or AO) are illustrated in the subsequent overview:
Reviewing the Settings of the Divergence Detector Indicator (MACD, RSI, or AO)
- Fractal Periods: Defines fractal periods for divergence identification, preset to 4;
- Divergence Detection Method: Selects the divergence detection approach from "MACD," "RSI," or "AO";
- Show Table: Activates the display of the divergence information table;
- Show Label: Enables the presentation of labels.
Conclusion
The Divergence Detector MACD + RSI + AO Oscillator facilitates the examination and recognition of divergences utilizing three instruments: MACD, RSI, and the AO Oscillator.
This oscillator graphically illustrates price divergences and ascertains if they are bullish or bearish via labels.