This harmonic structure can form in two variations:
- Bullish Crab Pattern – typically resembling the letter M
- Bearish Crab Pattern – typically resembling the letter W
Upon completion of the pattern, the indicator generates:
- Sell signals marked with a red arrow
- Buy signals marked with a green arrow
You can access the Indicator from this link:
https://tradingfinder.com/products/i...monic-pattern/
You can access the Indicator on the TradingView website:
https://www.tradingview.com/script/Q...hart-patterns/
Prop Firm DrawDown Protector : Prop Firm Capital Protection Expert MT5 |Forex Money Management: Forex Trade Management Expert MT5 | ICT Concepts Indicator MT5 |Smart Money Concepts Expert MT5 | Smart Money Trap Scanner |Get a free Expert Advisor license via Telegram and WhatsApp
Specifications of the Crab Harmonic Pattern Indicator
- Indicator Categories:
- Signal & Forecast TradingView Indicators
- Harmonic TradingView Indicators
- Chart & Classic TradingView Indicators
- Platforms: TradingView Indicators
- Trading Skill Level: Intermediate
- Indicator Type: Reversal TradingView Indicators
- Timeframe: Multi-Timeframe TradingView Indicators
- Trading Style: Intraday TradingView Indicators
- Applicable Markets:
- Forex Market
- Cryptocurrency Market
- Stock Market
- Forward Contracts
- Share Stocks
Structure of the Crab Harmonic Pattern
The Crab Harmonic Pattern is composed of five essential points: X, A, B, C, and D. These points are determined using precise Fibonacci retracement and extension levels.
- Point B: Retracement of XA between 38.2% and 61.8%
- Point C: Retracement of AB between 38.2% and 88.6%
- Point D (PRZ): Generally located at 161.8% of XA or higher
- In a Bullish Crab, Point D acts as a Buy Zone
- In a Bearish Crab, Point D acts as a Sell Zone
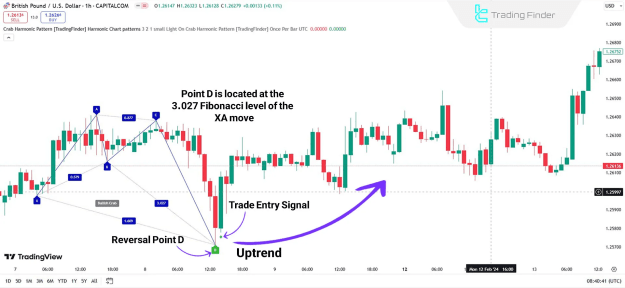
Crab Harmonic Indicator in an Uptrend
In an upward trend, the pattern begins with a bullish impulse wave, followed by a retracement before resuming the bullish movement.
Key details:
- Fibonacci ratios determine entry and exit levels.
- When the pattern completes and the indicator confirms the setup, a Buy signal (green arrow) is displayed.
- Example: GBP/USD currency pair in an uptrend scenario.
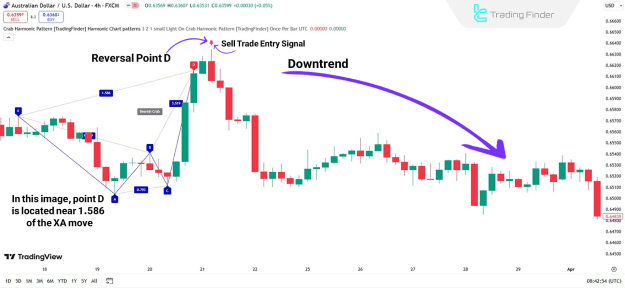
Crab Harmonic Indicator in a Downtrend
In a downward trend, the Bearish Crab Pattern resembles the letter W. The pattern usually begins with a corrective wave in a bearish market.
Key details:
- Price makes multiple oscillations before reaching a peak.
- At the PRZ, price reverses sharply, generating a Sell signal (red arrow).
- Example: AUD/USD currency pair in a downtrend scenario.
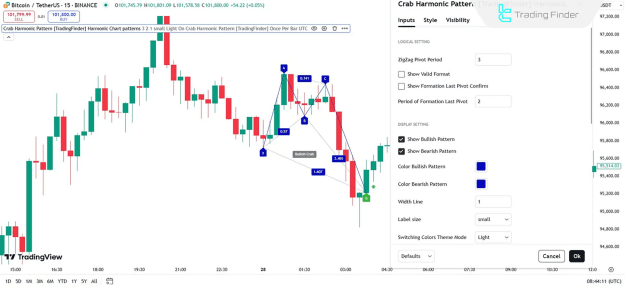
Indicator Settings
Logical Settings
- ZigZag Pivot Period: Default value – 3
- Show Valid Format: Enables display of only valid patterns
- Show Formation Last Pivot Confirm: Confirms last pivot formation
- Period of Formation Pivot: Default value – 2
Display Settings
- Show Bullish Pattern: Enable Bullish pattern visualization
- Show Bearish Pattern: Enable Bearish pattern visualization
- Bullish Pattern Color: Default – Blue
- Bearish Pattern Color: Default – Blue
- Line Width: Default thickness – 1
- Label Size: Adjustable
- Switching Colors Theme Mode: Chart theme selection
Alert Settings
- Alert: Generates notifications upon pattern completion
- Alert Name: Customizable
- Message Frequency: Adjustable alert repetition
- Show Alert Time by Time Zone: Localized alert timing
Conclusion
The Crab Harmonic Pattern Indicator is an advanced tool for traders utilizing Chart & Classic trading techniques. By automatically detecting harmonic price structures and calculating Potential Reversal Zones, it enables precise trade entries in multiple markets including Forex, stocks, and cryptocurrencies.