You can access the Indicator from this link:
https://tradingfinder.com/products/i...ower-of-three/
You can access the Indicator on the TradingView website:
https://www.tradingview.com/script/5...Accumulations/
Prop Firm DrawDown Protector : Prop Firm Capital Protection Expert MT5 |Forex Money Management: Forex Trade Management Expert MT5 | ICT Concepts Indicator MT5 |Smart Money Concepts Expert MT5 | Smart Money Trap Scanner |Get a free Expert Advisor license via Telegram and WhatsApp
ICT Power of 3 Indicator Specifications
- Indicator Categories: ICT TradingView Indicators, Smart Money TradingView Indicators, Liquidity TradingView Indicators
- Platforms: TradingView Indicators
- Trading Skills Level: Advanced
- Indicator Type: Leading TradingView Indicators
- Timeframes Supported: M1–M5, M15–M30, H1–H4
- Trading Style: Fast Scalping, Scalping
- Markets & Instruments: Forex TradingView Indicators, Cryptocurrency TradingView Indicators
Overview of the Strategy
The ICT Power of 3 concept divides the market into three distinct phases based on institutional order flow and time-price dynamics:
Accumulation Phase (19:00 – 01:00)
- Market makers quietly collect orders within horizontal ranges.
- Price remains relatively stable, avoiding drawing retail traders’ attention.
Manipulation Phase (01:00 – 07:00)
- False breakouts and liquidity traps are triggered.
- The market creates deceptive price moves to mislead retail traders.
Distribution Phase (07:00 – 13:00)
- Institutions close or offload positions.
- Price transitions into sharp and directional moves, initiating the main market trend.
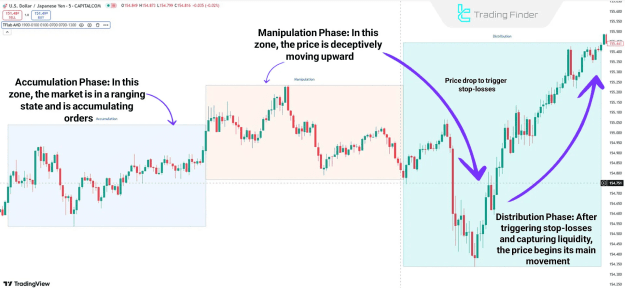
Indicator in an Uptrend
Example: USD/JPY on the 5-Minute Timeframe
- Accumulation: Price remains in a range, activating buy orders and building liquidity for the next move.
- Manipulation: A deceptive upward movement entices retail traders into poor entries.
- Distribution: Stop-loss levels are targeted, liquidity is collected, and the market continues strongly upward with the main bullish move.
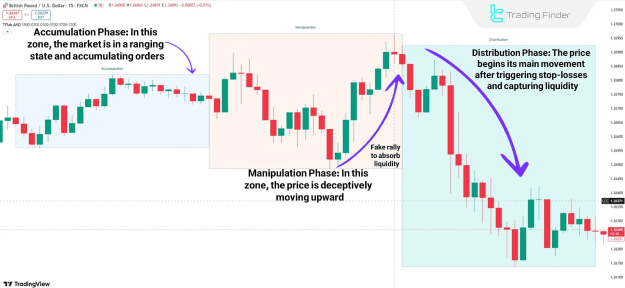
Indicator in a Downtrend
Example: GBP/USD on the 1-Hour Timeframe
- Accumulation: Price trades in a tight range without revealing the next major direction.
- Manipulation: False breakouts to the upside attract buyers before the real move.
- Distribution: Liquidity is gathered, stops are taken out, and price shifts aggressively into a bearish trend.
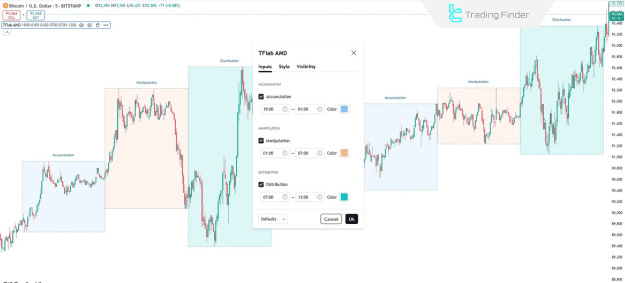
ICT Power of 3 Indicator Settings
- Accumulation Zone: 19:00 – 01:00 (Blue Zone)
- Manipulation Zone: 01:00 – 07:00 (Red Zone)
- Distribution Zone: 07:00 – 13:00 (Green Zone)
Conclusion
The ICT Power of 3 Indicator is a powerful analytical tool for traders who want to understand market structure through the lens of institutional trading behavior. By visually marking the Accumulation, Manipulation, and Distribution phases, this indicator transforms complex smart money concepts into a structured, time-based trading framework, allowing for more precise trade execution and market forecasting.