The VWAP Bands (Volume-Weighted Average Price Bands) indicator is a technical analysis tool designed to assess price fluctuations in relation to daily trading volume. Available on TradingView, this indicator is essential for identifying how volume impacts the overall price trend of an asset.
By integrating price and volume data, the VWAP Bands Indicator calculates a weighted average price over a defined time period, providing traders with valuable insights into potential market direction.
You can access the Indicator from this link:
https://tradingfinder.com/products/i...to-vwap-bands/
You can access the Indicator on the TradingView website:
https://www.tradingview.com/script/d...-Forex-Crypto/
Prop Firm DrawDown Protector : Prop Firm Capital Protection Expert MT5 |Forex Money Management: Forex Trade Management Expert MT5 | ICT Concepts Indicator MT5 |Smart Money Concepts Expert MT5 | Smart Money Trap Scanner | Get a free Expert Advisor license via Telegram and WhatsApp
Key Features of the VWAP Bands Indicator
By integrating price and volume data, the VWAP Bands Indicator calculates a weighted average price over a defined time period, providing traders with valuable insights into potential market direction.
You can access the Indicator from this link:
https://tradingfinder.com/products/i...to-vwap-bands/
You can access the Indicator on the TradingView website:
https://www.tradingview.com/script/d...-Forex-Crypto/
Inserted Video
Prop Firm DrawDown Protector : Prop Firm Capital Protection Expert MT5 |Forex Money Management: Forex Trade Management Expert MT5 | ICT Concepts Indicator MT5 |Smart Money Concepts Expert MT5 | Smart Money Trap Scanner | Get a free Expert Advisor license via Telegram and WhatsApp
Key Features of the VWAP Bands Indicator
- Indicator Categories:
- Support & Resistance Indicators (TradingView)
- Bands & Channels Indicators (TradingView)
- Levels Indicators (TradingView)
- Applicable Platforms:
- TradingView Indicators
- Trading Skills Required:
- Advanced
- Indicator Types:
- Reversal Indicators
- Lagging Indicators
- Breakout Indicators
- Timeframes:
- Multi-Timeframe
- Trading Styles:
- Day Trading
- Trading Instruments:
- Forex Pairs
- Cryptocurrencies
- Stocks
Understanding the Indicator Structure
- VWAP Line (Mid-Level): Represents the average price weighted by volume over a specified period.
- Upper & Lower Bands: Indicate dynamic support and resistance zones, helping traders identify potential reversal or breakout points.
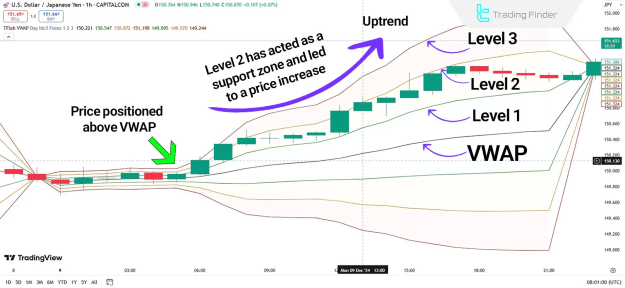
When the price is above VWAP, the lower bands act as support.
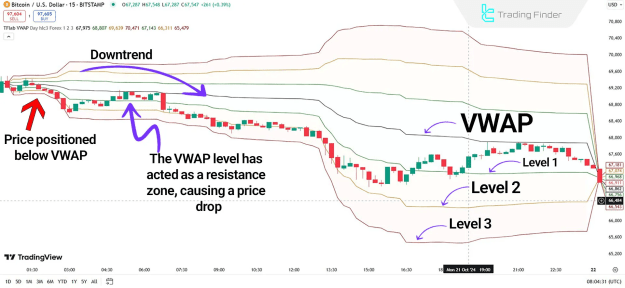
When the price is below VWAP, the upper bands act as resistance.
VWAP in Different Market Conditions
Uptrend Scenario
- In the USD/JPY chart, when the price moves above VWAP, it signals an uptrend or bullish momentum.
- Traders often interpret this as a buy signal.
Downtrend Scenario
- In the Bitcoin (BTC) 15-minute chart, a drop below VWAP indicates selling pressure and a bearish market.
- This is typically viewed as a sell signal.
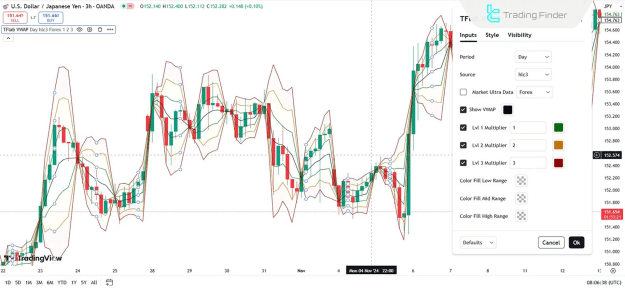
VWAP Bands Indicator Settings
- Period – Defines the calculation period.
- Source – Selects the price data source.
- Market Ultra Data – Enables enhanced market data.
- Show VWAP – Displays the VWAP line on the chart.
- Lvl 1, Lvl 2, Lvl 3 Multipliers – Adjusts the distance of the bands from the VWAP line.
- Color Fill Low/Mid/High Range – Customizes band colors for better visualization.
Conclusion
The VWAP Bands Indicator is a powerful analytical tool that merges price and volume data to identify prevailing market trends. It assists traders in:
- Determining trend direction
- Recognizing dynamic support and resistance zones
- Spotting optimal entry and exit points
Highly applicable to forex and crypto markets, this indicator is especially effective in markets influenced by trading volume, making it an essential component of advanced technical analysis strategies.
Attached Image(s) (click to enlarge)