You can access the Indicator from this link:
https://tradingfinder.com/products/i.../bpr-fvg-ifvg/
You can access the Indicator on the TradingView website:
https://www.tradingview.com/script/U...-BPR-FVG-IFVG/
Prop Firm DrawDown Protector : Prop Firm Capital Protection Expert MT4 | Forex Money Management: Forex Trade Management Expert MT4 |ICT Concepts Indicator MT4 | Smart Money Concepts Expert MT4| Smart Money Trap Scanner | Get a free Expert Advisor license via Telegram and WhatsApp
Overview of the BPR Indicator
The fundamental principle behind the BPR indicator is the identification of a Balanced Price Range (BPR) zone. This zone is created by the overlap of two Fair Value Gaps (FVG): a bullish FVG and a bearish FVG. According to ICT principles, this overlap creates a highly liquid area that the price tends to retrace to before continuing its primary trend.
This ICT-style indicator is a reversal trading tool available on the TradingView platform. It is especially useful for intraday trading and is applicable across multiple timeframes. The indicator can be used to analyze a wide range of financial instruments, including:
- Forex
- Cryptocurrency
- Stocks & Shares
- Commodities
- Indices
- Forwards
Analyzing Price Action with the BPR Indicator
The BPR indicator visually plots these zones on the chart, using different colors to distinguish between bullish and bearish signals. Price action often shows a strong reaction upon re-entering these zones.
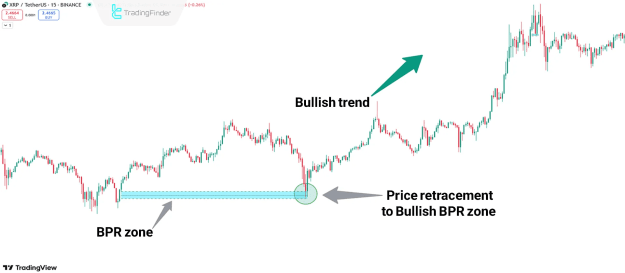
Bullish Balanced Price Range
The indicator marks a bullish BPR zone with a blue box. As demonstrated on the Ripple 15-minute chart, when the price forms a bullish BPR and subsequently corrects, it often retraces back to this zone. Upon interacting with the blue box, the price frequently finds support and begins a new bullish trend, confirming the zone's significance as a retracement level.
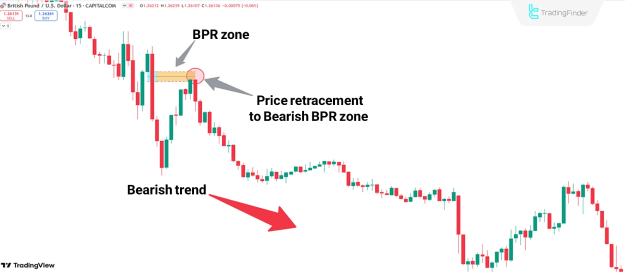
Bearish Balanced Price Range
Conversely, a bearish BPR zone is plotted with an orange box. The GBP/USD 15-minute chart provides a clear example of this. Immediately after a bearish BPR is formed, the price may retrace to this orange zone. Once it tests this area, the price often experiences a strong bearish reaction, continuing its downward momentum. This highlights the zone as a key resistance level for a downtrend.
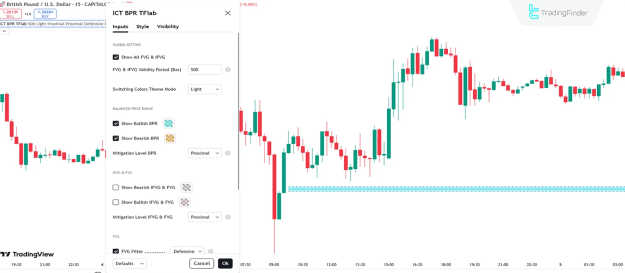
Customizing the Indicator's Settings
The BPR indicator offers extensive customization options, allowing traders to fine-tune its performance to their specific needs. The settings include:
- Show All FVG & IFVG: Displays all Fair Value Gaps and Inverted Fair Value Gaps.
- FVG & IFVG Validity Period: Sets the number of candles for which these gaps remain active (e.g., 500 candles).
- Switching Colors Theme Mode: Customizes the indicator's visual theme.
- Show Bullish BPR / Show Bearish BPR: Toggles the visibility of bullish and bearish BPR zones.
- Mitigation Level BPR: Displays the specific price level at which a BPR zone has been "mitigated" or re-entered.
- FVG Filter: Allows for filtering the type of FVG to be identified.
- Alerts Name & Alert BPR Mitigation: Enables custom alert names and notifications for when a BPR zone is mitigated.
- Message Frequency & Show Alert Time by Time Zone: Configures alert frequency and timing based on a specific time zone.
These settings provide traders with the flexibility to create a tailored analysis tool, ensuring they can effectively identify and capitalize on the significant price levels marked by the BPR indicator.
Conclusion
The KillZones Hunt + Sessions Indicator and the Balanced Price Range (BPR) indicator are both powerful tools on the TradingView platform, each offering a unique approach to market analysis based on advanced trading concepts. The KillZones indicator helps traders identify periods of high liquidity and volatility within the major trading sessions, while the BPR indicator, based on ICT principles, highlights specific price levels where reversals are likely to occur due to the overlap of Fair Value Gaps. Together, these indicators provide a comprehensive framework for day traders to analyze market structure, anticipate price movements, and identify optimal entry and exit points across various financial instruments.