You can access the Indicator from this link:
https://tradingfinder.com/products/i...hunt-sessions/
You can access the Indicator on the TradingView website:
https://www.tradingview.com/script/k...Volume-Ranges/
Prop Firm DrawDown Protector : Prop Firm Capital Protection Expert MT5 |Forex Money Management: Forex Trade Management Expert MT5 | ICT Concepts Indicator MT5 |Smart Money Concepts Expert MT5 | Smart Money Trap Scanner | Get a free Expert Advisor license via Telegram and WhatsApp
Understanding the Indicator's Functionality
The indicator's core function is to visualize the interplay between global trading sessions and price action. By displaying these timeframes as dotted lines and colored boxes on a chart, it allows traders to quickly identify periods of heightened market activity.
- Trading Sessions: The indicator outlines the main trading sessions, which are periods when specific regional markets are open and active. These sessions are marked by increased liquidity and unique price movements.
- Kill Zones: A Kill Zone is a specific, high-volume segment within a trading session. During these periods, trade volumes surge, and price fluctuations become more intense, often leading to significant price reversals or breakouts. The indicator highlights these zones with colored boxes.
This tool is categorized as a liquidity trading indicator and a session & killzone trading indicator, and is available on the TradingView platform. It is best suited for intermediate-level traders who engage in intraday trading and day trading across various instruments, including:
- Forex
- Cryptocurrency
- Stocks and Shares
- Commodities
- Indices
Analyzing Market Behavior with the Indicator
The indicator is designed to help traders anticipate and react to key market movements. By observing how different financial instruments behave within these Kill Zones, traders can make more informed decisions.
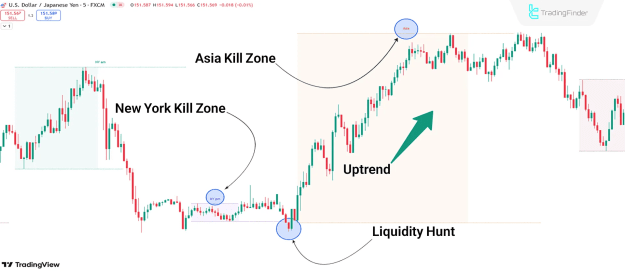
Uptrend Conditions
On the EUR/USD chart, for example, the price might show a reversal after a liquidity hunt in the New York Kill Zone, followed by a bullish move within the Asia Kill Zone. This pattern suggests that the price is reacting to institutional order flow and a shift in market sentiment during these specific high-volume periods.
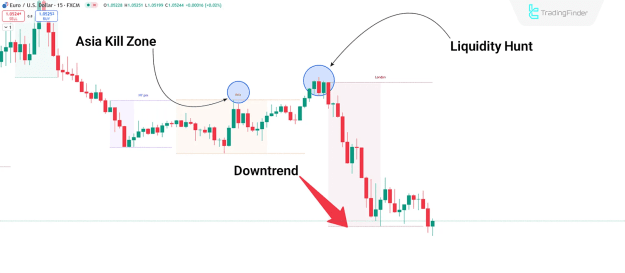
Downtrend Conditions
Similarly, on the USD/JPY chart, an initial false upward move might occur in the Asia Kill Zone, with the primary downward trend beginning only upon entering the London Kill Zone. This demonstrates how a Kill Zone can signal the start of a market's true directional movement for the day.
Customizing Indicator Settings
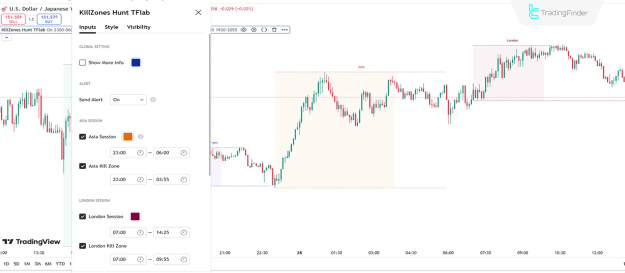
The Time Zone and Session Hunter indicator is highly customizable, allowing traders to adjust the settings to match their specific trading strategies and time zones. The default settings are based on UTC and can be configured as follows:
- Show More Info: Enables the display of additional information on the chart.
- Send Alert: Activates notifications for key events.
- Asia Session & Kill Zone: Defines the start and end times for the Asian session and its corresponding Kill Zone (e.g., Session: 23:00-06:00 UTC, Kill Zone: 23:00-03:55 UTC).
- London Session & Kill Zone: Defines the start and end times for the London session and its Kill Zone (e.g., Session: 07:00-14:25 UTC, Kill Zone: 07:00-09:55 UTC).
- New York AM Session & Kill Zone: Defines the start and end times for the morning New York session and its Kill Zone (e.g., Session: 14:30-19:25 UTC, Kill Zone: 14:30-16:55 UTC).
- New York PM Session & Kill Zone: Defines the start and end times for the afternoon/evening New York session and its Kill Zone (e.g., Session: 19:30-22:55 UTC, Kill Zone: 19:30-20:55 UTC).
Conclusion
By utilizing these customizable settings, traders can precisely align the indicator with their trading schedule and focus on the most relevant periods of market activity. The indicator’s ability to highlight these zones and potential breakouts makes it a critical component of a comprehensive trading strategy.