You can access the Indicator from this link:
https://tradingfinder.com/products/i...iew/ndog-nwog/
You can access the Indicator on the TradingView website:
https://www.tradingview.com/script/E...-Opening-Gaps/
Prop Firm DrawDown Protector : Prop Firm Capital Protection Expert MT4 | Forex Money Management: Forex Trade Management Expert MT4 |ICT Concepts Indicator MT4 | Smart Money Concepts Expert MT4| Smart Money Trap Scanner | Get a free Expert Advisor license via Telegram and WhatsApp
Specifications of the Daily/Weekly Opening Gap Indicator
This advanced indicator is highly versatile and fits into several trading categories:
- Indicator Categories: ICT, Supply & Demand, and Liquidity TradingView Indicators
- Platforms: TradingView
- Trading Skills: Advanced
- Indicator Types: Reversal TradingView Indicators
- Timeframe: Multi-Timeframe
- Trading Style: Intraday and Swing Trading
- Trading Instruments: Forex, Stocks, Commodities, and Share Stocks
The NDOG/NWOG indicator is an essential tool for traders who rely on price gaps to inform their trading decisions, especially within the ICT framework.
NDOG/NWOG Indicator Overview
This indicator automatically plots Daily Opening Gaps (NDOG) and Weekly Opening Gaps (NWOG) on the chart, using distinct colors to differentiate them (light blue and yellow boxes, respectively).
- Daily Opening Gap (NDOG): This is the price difference between the closing price of the previous day and the opening price of the current day.
- Weekly Opening Gap (NWOG): This gap represents the price difference between Friday's closing price and Sunday's opening price.
These plotted zones act as magnets for the price, which often returns to "fill" the gap before continuing its trend or reversing.
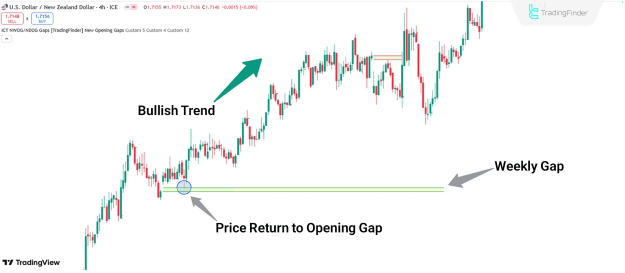
Performance in an Uptrend
On a 4-hour timeframe, a Weekly Opening Gap (NWOG) is plotted with a yellow box on a chart like the USD/NZD. When the price returns to this gap area, it can find support and react strongly, initiating or continuing an uptrend. This demonstrates how a gap can function as a powerful support zone.
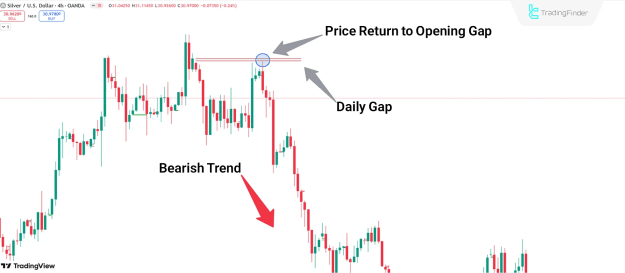
Performance in a Downtrend
Similarly, on a 4-hour chart of Silver/U.S. Dollar, a Daily Opening Gap (NDOG) is displayed with a light blue box. The price often returns to interact with this gap, which can act as a resistance level. After touching or filling the gap, the price can then resume its downtrend, validating the gap's role as a resistance zone.
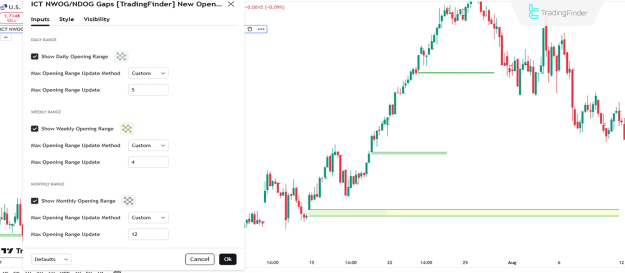
Indicator Settings
The NDOG/NWOG indicator offers customizable settings to suit a trader's specific needs and focus:
- Daily Range: Allows traders to display and configure daily opening gaps.
- Show Daily Opening Range: Enables/disables the plotting of daily gaps.
- Max Opening Range Update Method: Defines the method for updating the daily range.
- Max Opening Range Update: Sets the maximum number of daily gap updates (e.g., 5).
- Weekly Range: Provides options for displaying and adjusting weekly opening gaps.
- Show Weekly Opening Range: Enables/disables the plotting of weekly gaps.
- Max Opening Range Update Method: Defines the method for updating the weekly range.
- Max Opening Range Update: Sets the maximum number of weekly gap updates (e.g., 4).
- Monthly Range: Offers similar controls for monthly opening gaps.
- Show Monthly Opening Range: Enables/disables the plotting of monthly gaps.
- Max Opening Range Update Method: Defines the method for updating the monthly range.
- Max Opening Range Update: Sets the maximum number of monthly gap updates (e.g., 12).
Conclusion
The Daily and Weekly Opening Gap Indicator (NDOG/NWOG) is a highly effective tool for analyzing price discrepancies between opening and closing prices on different time scales. These gaps often act as Support and Resistance zones, a key concept in the ICT trading style. By plotting these liquidity voids, the indicator provides traders with valuable insights and potential trade entry opportunities when the price returns to fill them. It is an indispensable tool for anyone who follows supply and demand principles in their trading.