- Measures institutional order flow by aggregating volume deltas
- Identifies hidden divergences before price reversals occur
- Works across cryptocurrencies, forex, and stocks
- Provides clear visual signals for trade entries and exits
You can access the Indicator from this link:
https://tradingfinder.com/products/i...ume-delta-ema/
You can access the Indicator on the TradingView website:
https://www.tradingview.com/script/G...-Periodic-EMA/
Prop Firm DrawDown Protector : Prop Firm Capital Protection Expert MT5 |Forex Money Management: Forex Trade Management Expert MT5 | ICT Concepts Indicator MT5 |Smart Money Concepts Expert MT5 | Smart Money Trap Scanner | Get a free Expert Advisor license via Telegram and WhatsApp
How the CVD Indicator Works
Core Mechanism
The CVD calculates the net difference between buying and selling volumes across consecutive candles, creating a cumulative line that shows:
- Upward Movement = Buyers in control (bullish)
- Downward Movement = Sellers dominating (bearish)
Key Features
- Divergence Detection: Spots discrepancies between price and volume
- Multi-Timeframe Analysis: Effective from M1 to D1 charts
- Market-Wide Application: Adapts to any liquid trading instrument
Trading Strategies with CVD
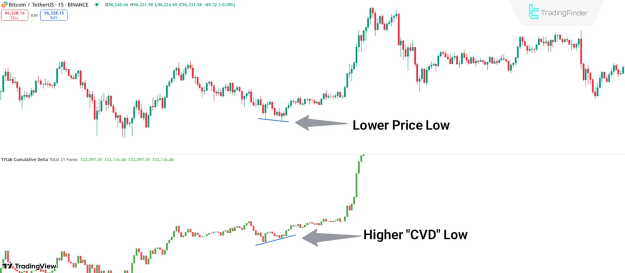
Bullish Reversal Setup (BTC/USD Example)
On the Bitcoin 15-minute chart:
- Price makes lower lows while CVD forms higher lows
- This bullish divergence signals weakening selling pressure
- Confirmed when CVD line turns upward = Optimal buy entry
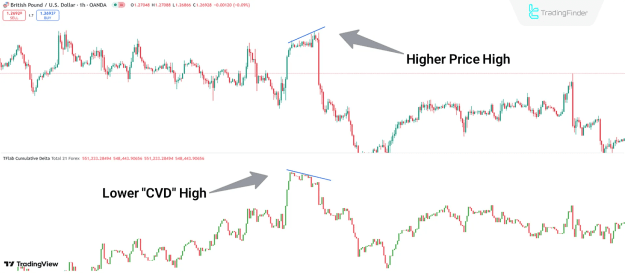
Bearish Reversal Setup (GBP/USD Example)
On the GBP/USD 1-hour chart:
- Price creates higher highs while CVD shows lower highs
- This bearish divergence indicates fading buying momentum
- Confirmed when CVD line turns downward = Ideal short opportunity
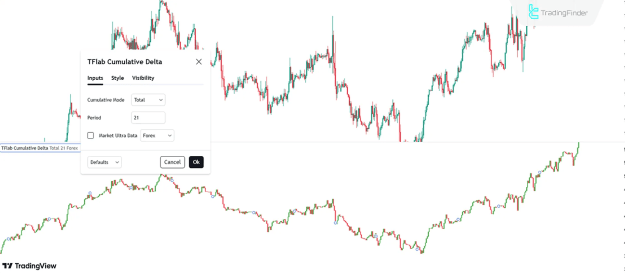
Advanced Configuration Options
Customizable Settings
- Cumulative Mode: Toggle between aggressive/standard calculation
- Period Adjustment: Default 21 periods (optimizable for strategy)
- Market Data Selection: Choose between standard/ultra data feeds
Why Traders Need This Indicator
![]() Institutional Insight: Reveals smart money activity
Institutional Insight: Reveals smart money activity
![]() Early Warning System: Spots reversals before price confirms
Early Warning System: Spots reversals before price confirms
![]() Universal Compatibility: Works on all chart types and markets
Universal Compatibility: Works on all chart types and markets
![]() Strategy Validation: Confirms other technical signals
Strategy Validation: Confirms other technical signals
![]() Clear Visualization: Simple line format for quick analysis
Clear Visualization: Simple line format for quick analysis
Professional Trading Applications
- Day Trading: Identify intraday momentum shifts
- Swing Trading: Catch larger trend reversals
- Position Trading: Confirm long-term accumulation/distribution
Conclusion
The CVD Indicator transforms complex volume analysis into actionable trading signals. By tracking the cumulative flow of smart money, traders gain:
- Higher-probability entries with volume confirmation
- Early exit signals before major reversals
- Deeper market understanding through price-volume relationships
Whether trading crypto volatility, forex trends, or stock movements, the CVD Indicator provides the professional edge needed to compete in today's markets.