- Measures real-time volume imbalances between buyers and sellers
- Identifies accumulation and distribution patterns
- Predicts potential trend reversals before price action confirms them
- Works across Forex, Stocks, and Cryptocurrency markets
You can access the Indicator from this link:
https://tradingfinder.com/products/i...lta-histogram/
You can access the Indicator on the TradingView website:
https://www.tradingview.com/script/6...CVD-Histogram/
Prop Firm DrawDown Protector : Prop Firm Capital Protection Expert MT5 |Forex Money Management: Forex Trade Management Expert MT5 | ICT Concepts Indicator MT5 |Smart Money Concepts Expert MT5 | Smart Money Trap Scanner | Get a free Expert Advisor license via Telegram and WhatsApp
How the CVD Histogram Works
Core Functionality
The indicator calculates the net difference between buying and selling volumes for each candlestick and displays it as a cumulative histogram:
- Green Bars: Indicate buying pressure dominance
- Taller bars = Stronger buyer control
- Red Bars: Show selling pressure dominance
- Taller bars = Stronger seller control
Key Features
- Cumulative Calculation: Provides ongoing assessment of volume trends
- Multi-Timeframe Compatibility: Effective from M1 to D1 charts
- Clear Visual Signals: Instant recognition of market shifts
Trading with CVD Histogram: Practical Applications
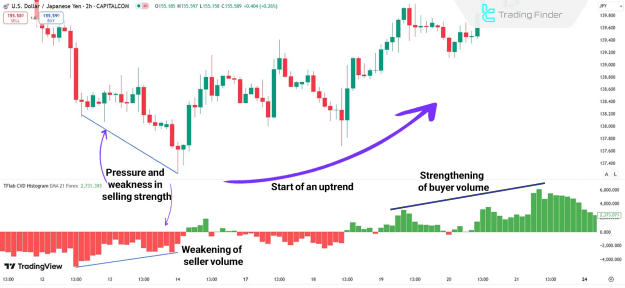
Bullish Market Conditions (USD/JPY Example)
When analyzing the USD/JPY 2H chart:
- Decreasing red bars signal weakening selling pressure
- This often precedes bullish reversals as buyers regain control
- Traders can look for long entries when histogram turns green
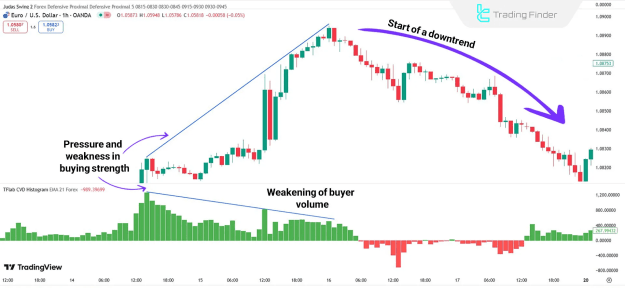
Bearish Market Conditions (EUR/USD Example)
On the EUR/USD 1H chart:
- Shrinking green bars indicate fading buying momentum
- This frequently leads to bearish reversals as sellers take over
- Traders can consider short positions when histogram turns red
Advanced Indicator Settings
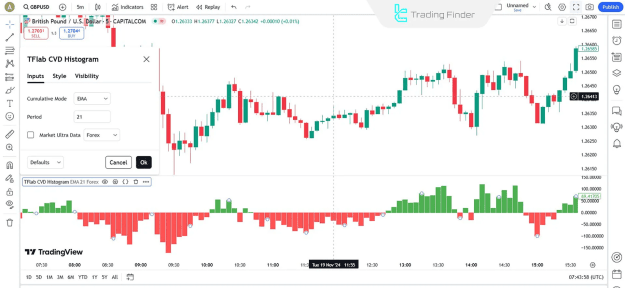
Customization Options
- Cumulative Mode: Toggle between cumulative/non-cumulative display
- Period Adjustment: Modify calculation period for sensitivity
- Market Ultra Data: Enable for enhanced precision (recommended)
Why Professional Traders Use CVD Histogram
 Early Reversal Signals: Spot trend changes before price confirms
Volume Confirmation: Validate price action with volume data
Multi-Market Application: Works across all liquid instruments
Clear Visual Interpretation: Color-coded bars for instant analysis
Strategy Enhancement: Complements other technical indicators
Conclusion
The CVD Histogram Indicator transforms complex volume data into actionable trading insights. By revealing the true balance of power between buyers and sellers, this tool helps traders:
- Anticipate trend reversals with greater accuracy
- Confirm entry/exit points with volume validation
- Develop robust strategies combining price and volume analysis
Whether you're a day trader, swing trader, or position trader, incorporating the CVD Histogram into your technical analysis provides the institutional-grade edge needed in today's competitive markets.