You can access the Indicator from this link:
https://tradingfinder.com/products/i.../xamd-amdx-01/
You can access the Indicator on the TradingView website:
https://www.tradingview.com/script/6...Theory-Cycles/
Prop Firm DrawDown Protector : Prop Firm Capital Protection Expert MT5 |Forex Money Management: Forex Trade Management Expert MT5 | ICT Concepts Indicator MT5 |Smart Money Concepts Expert MT5 | Smart Money Trap Scanner |Get a free Expert Advisor license via Telegram and WhatsApp
XAMD/AMDX [01] Indicator Specifications
Indicator Categories
- ICT Tradingview Indicators
- Smart Money Tradingview Indicators
- Liquidity Tradingview Indicators
Platforms
- TradingView Indicators
Trading Skills
- Advanced
Indicator Types
- Reversal Tradingview Indicators
Timeframe
- Multi-Timeframe Tradingview Indicators
Trading Style
- Intraday Tradingview Indicators
Trading Instruments
- Forex Market
- Cryptocurrency Trading
- Stock Trading
- Commodity Trading
- Indices Trading
- Share Stocks
Overview of the Indicator
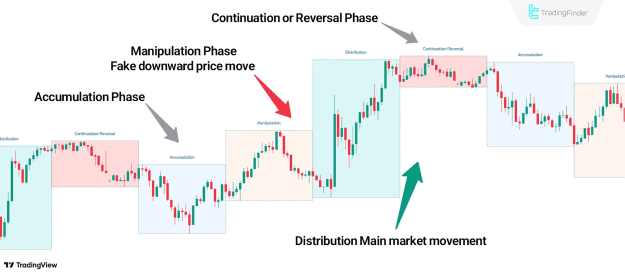
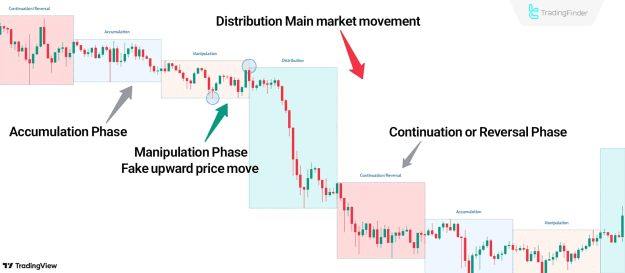
The XAMD/AMDX strategy outlines four market rotation phases:
- Accumulation: The market is typically calm during this phase as institutional players, or Market Makers, accumulate their positions.
- Manipulation: In this phase, Market Makers create fake breakouts to trigger stop-loss levels.
- Distribution: The primary trend of the day forms during the distribution phase. This phase is characterized by significant and sharp price movements driven by large transactions from market makers.
- Continuation or Reversal: This final phase evaluates the market's direction and can signal a price reversal or continuation of the current trend.
Performance of the Indicator in a Bullish Trend
An analysis of the USD/JPY currency pair on a 30-minute timeframe demonstrates the indicator's effectiveness. The trend entered the manipulation phase with a fake downward move. However, as soon as the price entered the distribution phase, it began its main upward trend, confirming the indicator's bullish signal.
Performance of the Indicator in a Bearish Trend
The ETH cryptocurrency price chart on a 15-minute timeframe illustrates how the XAMD/AMDX [01] indicator functions during a bearish trend. During the manipulation phase, fake upward moves occur. Once the price moves into the distribution phase, the main market move begins, and the trend turns bearish.
Indicator Settings
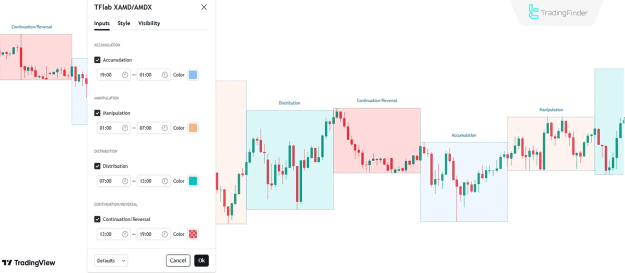
Overview of Indicator Settings
- Accumulation: Settings for customizing the accumulation phase.
- Manipulation: Settings for the manipulation phase.
- Distribution: Settings for the distribution phase.
- Continuation/Reversal: Settings for the continuation or reversal phase.
Conclusion
The XAMD/AMDX Quarterly Theory Cycle Indicator effectively divides daily market movements into four distinct phases. Each phase displays unique price behavior. By analyzing these behaviors, traders can achieve clearer and more precise forecasts of future price movements. This smart money indicator empowers traders to align their strategies with the primary market maker moves.