You can access the Indicator from this link:
https://tradingfinder.com/products/i...monic-pattern/
You can access the Indicator on the TradingView website:
https://www.tradingview.com/script/p...der-ALT-Shark/
Prop Firm DrawDown Protector : Prop Firm Capital Protection Expert MT5 |Forex Money Management: Forex Trade Management Expert MT5 | ICT Concepts Indicator MT5 |Smart Money Concepts Expert MT5 | Smart Money Trap Scanner | Get a free Expert Advisor license via Telegram and WhatsApp
Indicator Overview and Key Features
The Alternative Shark Harmonic Pattern is a powerful tool for identifying potential price reversals. Its core features include:
- Indicator Categories: It is classified as a Signal & Forecast Tradingview Indicator, Harmonic Tradingview Indicator, and Chart & Classic Tradingview Indicator.
- Platform: The indicator is designed for the TradingView platform.
- Skill Level: It is suitable for traders with an Intermediate skill level.
- Indicator Type: This tool functions as a Reversal Tradingview Indicator.
- Timeframe: It is a Multi-Timeframe Tradingview Indicator.
- Trading Style: It is ideal for Intraday Trading.
- Trading Instruments: The indicator is compatible with various markets, including Forex, Cryptocurrency, and Share Stocks.
The Structure of the Pattern
The Alternative Shark Harmonic Pattern is defined by five key points: X, A, B, C, and D.
- Wave XA: The price moves from point X to point A.
- Wave AB: A corrective phase follows, with the price moving to point B. This correction typically falls between the 0.382 and 0.618 Fibonacci ratios of the XA wave.
- Wave BC: The price extends from point B to point C, which is an extension wave usually measuring between 1.13 and 1.618 of the AB wave.
- Point D: The pattern concludes at point D, which marks the Potential Reversal Zone (PRZ).
Trading with the Indicator
The Alternative Shark Harmonic Pattern Indicator provides clear signals for both uptrend and downtrend reversals.
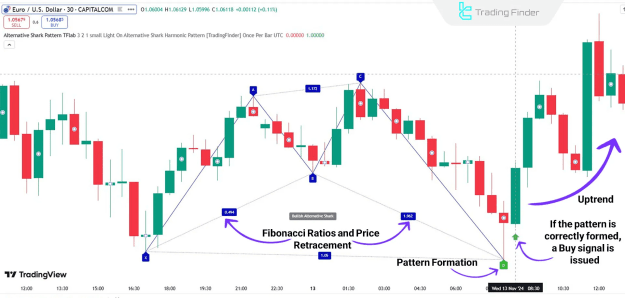
Reversal from a Downtrend
The indicator can identify a bullish Shark Pattern at the end of a downtrend. On a 30-minute EUR/USD chart, for instance, the indicator plots the pattern. Upon completion at point D and subsequent confirmation, the price is expected to reverse to the upside. The indicator then issues a buy signal (a green arrow), providing a high-probability entry point for a long trade.
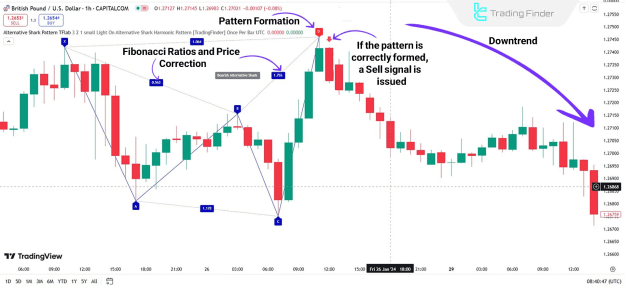
Reversal from an Uptrend
Similarly, the indicator can spot a bearish Shark Pattern at the conclusion of an uptrend. In a 1-hour GBP/USD chart, for example, the indicator identifies the pattern. Once the price returns to point D, confirming the reversal, the indicator issues a sell signal (a red arrow). This signal indicates an optimal entry point for a short trade, allowing traders to capitalize on a new downtrend.
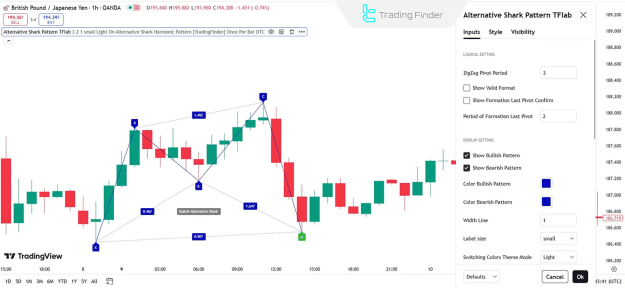
Customizing Indicator Settings
The indicator provides several customizable settings to enhance its functionality and display.
- Pivot and Confirmation:
- ZigZag Pivot Period: Sets the number of candles for calculating pivot points (default: 3).
- Show Valid Format: Toggles the display of valid patterns.
- Show Formation Last Pivot Confirm: Enables confirmation for the last pivot point.
- Period of Formation Last Pivot: Sets the period for calculating the final pivot confirmation.
- Pattern Display:
- Show Bullish/Bearish Pattern: Toggles the visibility of bullish and bearish patterns.
- Color Bullish/Bearish Pattern: Allows for color customization of each pattern type.
- Width Line: Adjusts the thickness of the pattern lines.
- Label Size: Configures the size of text labels on the chart.
- Switching Colors Theme Mode: Provides an option for light or dark themes.
- Alerts and Notifications:
- Alert: Enables alerts when a pattern is formed.
- Alert Name: A customizable name for alerts.
- Message Frequency: Sets the frequency of alert messages.
- Show Alert Time by Time Zone: Displays alert times based on the selected time zone.
Conclusion
The Alternative Shark Harmonic Pattern Indicator is an essential technical analysis tool for identifying the Alternative Shark Harmonic Pattern and pinpointing price reversal zones. By leveraging key Fibonacci ratios, the indicator effectively highlights critical levels where a trend is likely to reverse. Its graphical representation and automatic signal generation allow traders to identify high-probability trading opportunities and optimize their strategies.