In the structure of the ABCD pattern:
- Waves AB and CD move in the same direction.
- Wave BC acts as a corrective move in the opposite direction.
- A bullish signal is represented by a green arrow, while a sell signal is shown by a red arrow.
You can access the Indicator from this link:
https://www.metalsmine.com/forum/158...ent/new-thread
You can access the Indicator on the TradingView website:
https://www.tradingview.com/script/F...ern-indicator/
Prop Firm DrawDown Protector : Prop Firm Capital Protection Expert MT5 |Forex Money Management: Forex Trade Management Expert MT5 | ICT Concepts Indicator MT5 |Smart Money Concepts Expert MT5 | Smart Money Trap Scanner |Get a free Expert Advisor license via Telegram and WhatsApp
Indicator Categories
- Signal & Forecast TradingView Indicators
- Harmonic TradingView Indicators
- Chart & Classic TradingView Indicators
Platforms: TradingView Indicators
Trading Skills: Intermediate
Indicator Type: Reversal TradingView Indicators
Timeframe: Multi-Timeframe TradingView Indicators
Trading Style: Intraday TradingView Indicators
Markets: Forex, Cryptocurrency, Forward Trading, Stock Shares
Key Features at a Glance
The ABCD Harmonic Pattern Indicator uses Fibonacci retracements and extensions to accurately detect PRZ areas:
- Point C retracement: Typically between 0.382 and 0.886 of wave AB.
- Wave CD extension: Usually between 1.13 and 2.618 of wave BC.
- Point D: Identified as the final reversal zone where trade signals are issued.
Once the PRZ is confirmed, the indicator automatically generates buy or sell trade entry signals.
ABCD Pattern in an Uptrend
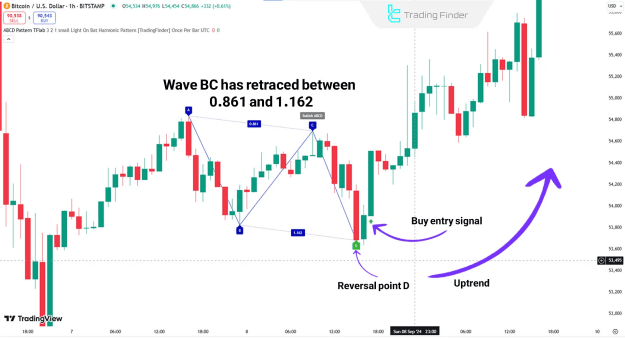
Example: 1-hour Bitcoin (BTC) Chart
- The indicator first detects a bearish AB wave.
- Wave BC moves upward, retracing between 0.861 and 1.162 of AB.
- A bearish CD wave forms and price reaches point D.
- At the PRZ, the indicator issues a Buy entry signal.
ABCD Pattern in a Downtrend
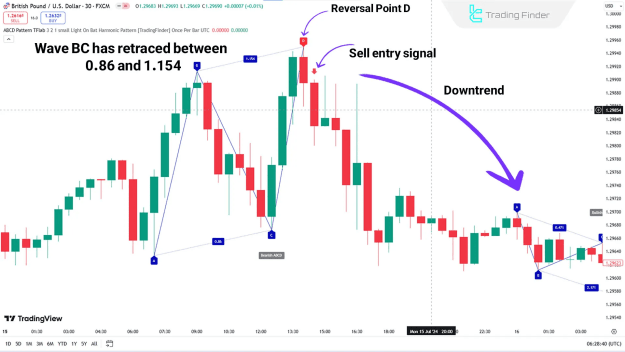
Example: 30-minute GBP/USD Chart
- The price forms a bullish AB wave.
- Wave BC retraces downward between 0.86 and 1.154 of AB.
- Wave CD moves upward to point D.
- Point D is identified as the PRZ, triggering a Sell entry signal.
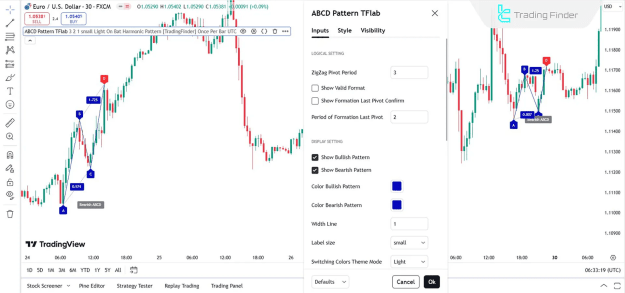
Indicator Settings
- ZigZag Pivot Period: Default set to 3
- Show Valid Format: Displays only valid ABCD patterns
- Last Pivot Confirmation: Shows confirmation of the final pivot point
- Show Bullish/Bearish Pattern: Enable or disable detection for each type
- Pattern Colors: Default blue for bullish, red for bearish
- Line Width & Label Size: Adjustable for visibility
- Theme Mode: Adapt indicator visuals to chart background
- Alerts: Configure custom alerts with adjustable name, frequency, and time zone
Conclusion
The ABCD Harmonic Pattern Indicator is an advanced, automated TradingView tool for identifying bullish and bearish harmonic patterns using Fibonacci ratios. Its precise PRZ detection helps traders spot potential reversal points and make informed entry decisions.
With customizable settings for colors, line thickness, labels, and alerts, this indicator is ideal for traders who want to integrate harmonic pattern analysis into their Forex, cryptocurrency, and stock trading strategies.