Available on the TradingView platform, this indicator automatically plots five key points (X-A-B-C-D) that are connected by specific Fibonacci ratios. The 5-0 pattern is a recognized reversal pattern that often forms after a strong trend, signaling a potential change in market direction.
You can access the Indicator from this link:
https://tradingfinder.com/products/i...monic-pattern/
You can access the Indicator on the TradingView website:
https://www.tradingview.com/script/9...onic-Detector/
Prop Firm DrawDown Protector : Prop Firm Capital Protection Expert MT5 |Forex Money Management: Forex Trade Management Expert MT5 | ICT Concepts Indicator MT5 |Smart Money Concepts Expert MT5 | Smart Money Trap Scanner |Get a free Expert Advisor license via Telegram and WhatsApp
Overview of the Harmonic Pattern Indicator
The indicator identifies a series of price movements to form the complete pattern:
- The initial price move is identified from Point X to A.
- A significant price correction then occurs from Point A to B.
- A second corrective move takes place between Points B and C.
- The final segment of the pattern is formed from Point C to D.
The 5-0 Indicator automates this process by plotting these points directly on your chart, making it easier to identify the pattern as it develops.
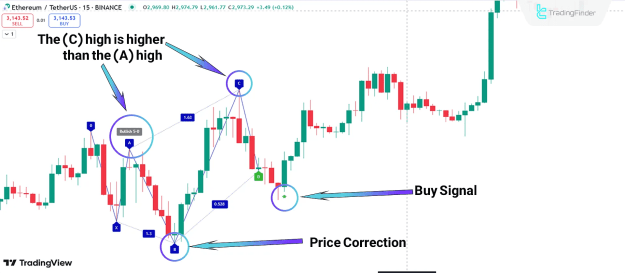
Bullish 5-0 Harmonic Pattern
In a bullish 5-0 pattern, the indicator signals a potential buying opportunity. This is how the pattern unfolds:
- The price initially moves upward from Point X to A.
- A price correction occurs, moving from Point A to B.
- The price then rises again to reach Point C, forming a new high that is higher than Point A.
- The pattern is completed when the price moves to Point D.
- The indicator automatically plots a green arrow at Point D, suggesting a buy entry.
This pattern is a clear indication that a previous downward trend may be reversing.
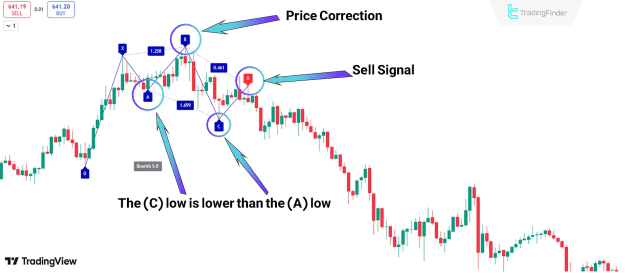
Bearish 5-0 Harmonic Pattern
Conversely, a bearish 5-0 pattern signals a potential selling opportunity. The pattern develops as follows:
- The price initially moves downward from Point X to A.
- An upward price correction occurs from Point A to B.
- The price then decreases to reach Point C, forming a new low that is lower than Point A.
- The pattern is completed when the price moves to Point D.
- The indicator automatically plots a red arrow at Point D, suggesting a sell entry.
This pattern suggests that a previous upward trend may be reversing.
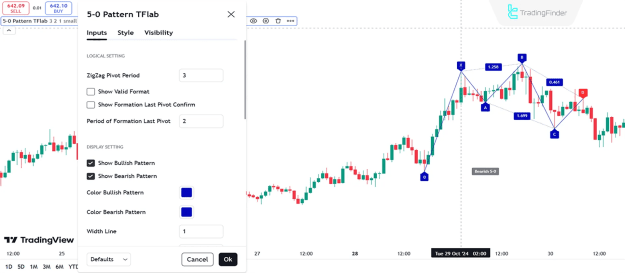
Indicator Settings
The 5-0 Harmonic Pattern Indicator offers several customizable settings to suit a trader's specific needs:
- ZigZag Pivot Period: Adjusts the sensitivity of the zigzag line.
- Show Valid Format: Displays patterns that meet specific conditions.
- Show Formation Last Pivot Confirm: Confirms the final pivot point of the pattern.
- Period of Formation Last Pivot: Specifies the confirmation period for the last pivot.
- Show Bullish/Bearish Pattern: Enables or disables the display of bullish or bearish patterns.
- Color Bullish/Bearish Pattern: Customizes the color of the patterns.
- Width Line: Adjusts the thickness of the pattern lines.
- Label Size: Controls the size of the labels on the chart.
- Switching Colors Theme Mode: Changes the indicator's color theme.
- Alert: Allows you to set up custom alerts for when a pattern is identified.
These settings give traders full control over how the indicator appears and functions.
Conclusion
The 5-0 Harmonic Pattern Indicator is a valuable tool for traders looking to identify potential reversal points. When used alongside a robust risk management strategy and other technical analysis tools, it can significantly improve trading accuracy. This harmonic indicator automates the process of identifying and plotting the pattern, providing clear arrow markers to issue entry signals under the right conditions. It's an ideal tool for intermediate traders who utilize an intraday trading style across various markets, including Forex, cryptocurrencies, stocks, and commodities.