The bullish Three Drive pattern occurs when three consecutive lower lows form, signaling potential upward reversals. Conversely, the bearish Three Drive pattern is created by three consecutive higher highs, indicating potential downward reversals.
With this indicator, traders can quickly identify strong reversal points and take timely action when market momentum shifts.
You can access the Indicator from this link:
https://tradingfinder.com/products/i...w/three-drive/
You can access the Indicator on the TradingView website:
https://www.tradingview.com/script/9...ern-Indicator/
Prop Firm DrawDown Protector : Prop Firm Capital Protection Expert MT5 |Forex Money Management: Forex Trade Management Expert MT5 | ICT Concepts Indicator MT5 |Smart Money Concepts Expert MT5 | Smart Money Trap Scanner |Get a free Expert Advisor license via Telegram and WhatsApp
Indicator Overview
- Category: Price Action, Harmonic Patterns, Chart & Classic TradingView Indicators
- Platform: TradingView
- Skill Level: Intermediate
- Type: Reversal, Leading, Entry & Exit Trading Indicators
- Timeframe: Multi-Timeframe (Scalping, Intraday, Day Trading)
- Instruments: Forex, Commodities, Indices
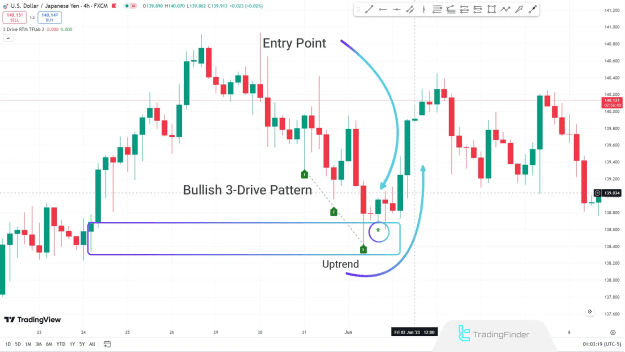
Bullish Three Drive Pattern
Example: USD/JPY – 4-Hour Chart
In a bullish reversal Three Drive pattern, the market forms three consecutive lower lows, typically near a significant support zone.
Key Characteristics:
- The second low extends below the first low’s level.
- The third low forms near the second low’s range.
- Selling pressure weakens as buying momentum increases.
When the third low completes, the indicator issues a buy signal, allowing traders to enter long positions at a suitable price level.
Profit Target:
- The area where the prior downtrend began.
- Resistance levels formed during the pattern’s creation.
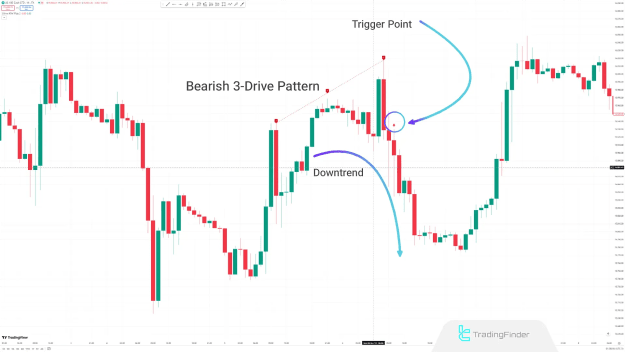
Bearish Three Drive Pattern
Example: NASDAQ (US100) – 1-Hour Chart
A bearish Three Drive pattern emerges during an uptrend when the price creates three consecutive higher highs.
Formation Process:
- Price breaks above the first high to form the second high.
- Price then moves above the second high to create the third high.
- Completion signals a potential trend reversal to the downside.
The indicator plots the pattern directly on the chart and issues a sell signal, helping traders enter short positions at the optimal moment.
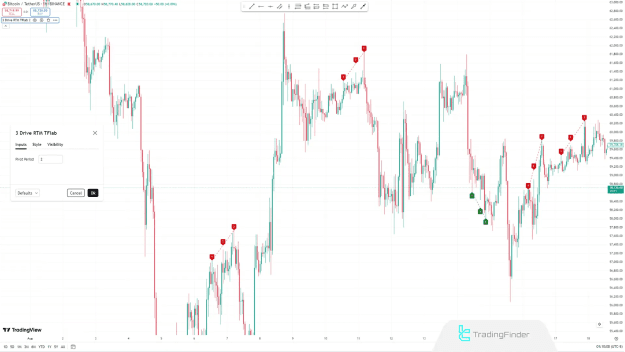
Indicator Settings
Example: Bitcoin – 1-Hour Chart
- Pivot Period: Determines the reversal axis for detecting drive points.
Conclusion
The Three Drive Harmonic Pattern Indicator is a reliable reversal detection tool that enables traders to capitalize on market turning points.
While confirmation is not strictly necessary, incorporating this pattern into supply and demand zones or support and resistance levels significantly improves trade accuracy and reduces risk exposure.
By combining this indicator with disciplined trade management, traders can enhance profitability in Forex, commodities, and indices markets.