The Cumulative Volume Delta (CVD) Indicator is a powerful analytical tool available on TradingView. It is designed to measure the imbalance between buying and selling pressure by calculating the difference between buying and selling volume over a specific period. A positive delta signifies a greater presence of buying volume, indicating bullish sentiment, while a negative delta points to stronger selling volume, suggesting bearish sentiment.
The primary function of the CVD indicator is to confirm the prevailing market trend. An increasing value with a positive slope supports an uptrend, whereas a decreasing value with a negative slope validates a downtrend. Furthermore, traders can use divergences between the price and the indicator to forecast potential changes in the market's direction with a high degree of accuracy.
You can access the Indicator from this link:
https://tradingfinder.com/products/i...-volume-delta/
You can access the Indicator on the TradingView website:
https://www.tradingview.com/script/G...-Periodic-EMA/
Prop Firm DrawDown Protector : Prop Firm Capital Protection Expert MT4 | Forex Money Management: Forex Trade Management Expert MT4 |ICT Concepts Indicator MT4 | Smart Money Concepts Expert MT4| Smart Money Trap Scanner | Get a free Expert Advisor license via Telegram and WhatsApp
Overview of the CVD Indicator
The CVD Indicator is a crucial tool for traders who rely on the market's primary trend. One of its most significant applications is identifying divergences, which can provide strong signals for potential market reversals. This tool continuously calculates the real-time buy and sell volume, allowing traders to estimate the intensity of volume within a current trend and predict future price movements.
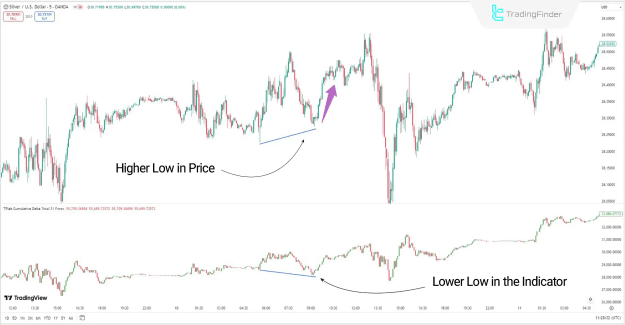
Uptrend Confirmation with Bullish Divergence
A Bullish Divergence occurs when the price forms a higher low while the Cumulative Volume Delta indicator simultaneously registers a lower low. This condition, as seen in a 5-minute silver price chart, suggests that selling pressure is weakening even as the price holds its ground. Such a divergence can be a strong signal for a potential reversal into an uptrend.
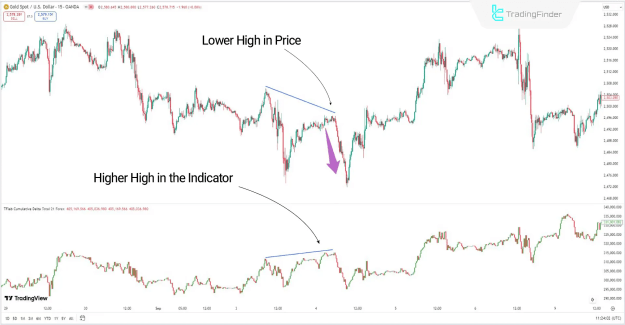
Downtrend Confirmation with Bearish Divergence
Conversely, a Bearish Divergence is observed when the price creates a lower high while the CVD indicator records a higher high. This pattern, which can be found in a 15-minute gold price chart, indicates that buying pressure is losing momentum despite the price's attempt to reach a new high. A Bearish Divergence often precedes a potential reversal into a downtrend.
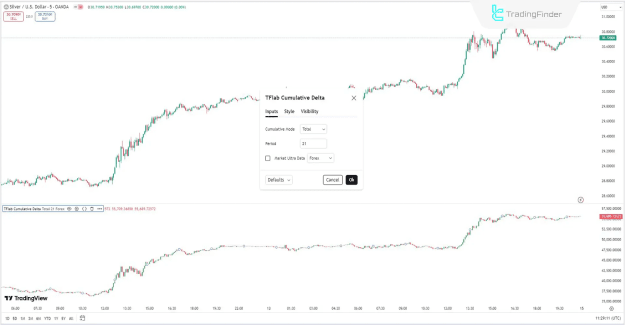
Customizing the CVD Indicator
The primary function of the CVD indicator is to confirm the prevailing market trend. An increasing value with a positive slope supports an uptrend, whereas a decreasing value with a negative slope validates a downtrend. Furthermore, traders can use divergences between the price and the indicator to forecast potential changes in the market's direction with a high degree of accuracy.
You can access the Indicator from this link:
https://tradingfinder.com/products/i...-volume-delta/
You can access the Indicator on the TradingView website:
https://www.tradingview.com/script/G...-Periodic-EMA/
Inserted Video
Prop Firm DrawDown Protector : Prop Firm Capital Protection Expert MT4 | Forex Money Management: Forex Trade Management Expert MT4 |ICT Concepts Indicator MT4 | Smart Money Concepts Expert MT4| Smart Money Trap Scanner | Get a free Expert Advisor license via Telegram and WhatsApp
Overview of the CVD Indicator
The CVD Indicator is a crucial tool for traders who rely on the market's primary trend. One of its most significant applications is identifying divergences, which can provide strong signals for potential market reversals. This tool continuously calculates the real-time buy and sell volume, allowing traders to estimate the intensity of volume within a current trend and predict future price movements.
Uptrend Confirmation with Bullish Divergence
A Bullish Divergence occurs when the price forms a higher low while the Cumulative Volume Delta indicator simultaneously registers a lower low. This condition, as seen in a 5-minute silver price chart, suggests that selling pressure is weakening even as the price holds its ground. Such a divergence can be a strong signal for a potential reversal into an uptrend.
Downtrend Confirmation with Bearish Divergence
Conversely, a Bearish Divergence is observed when the price creates a lower high while the CVD indicator records a higher high. This pattern, which can be found in a 15-minute gold price chart, indicates that buying pressure is losing momentum despite the price's attempt to reach a new high. A Bearish Divergence often precedes a potential reversal into a downtrend.
Customizing the CVD Indicator
- Cumulative Mode: The indicator features three modes. The default mode, Total, accumulates volume from the start of the chart.
- Period: The default period for the indicator is set to 21.
- Description: In Periodic mode, the indicator accumulates volume over set periods, while the EMA (Exponential Moving Average) mode calculates a moving average of the volume for smoother trend analysis.
Summary
The CVD indicator is an invaluable technical analysis tool for understanding market dynamics. By aggregating the volume delta for each candlestick, it effectively measures buying and selling pressure and helps traders anticipate future trends. An upward-sloping CVD indicates increasing buying pressure, while a downward-sloping CVD suggests growing selling pressure. This indicator is particularly effective in identifying signals in highly volatile markets.
Attached Image(s) (click to enlarge)