Prop Firm DrawDown Protector : Prop Firm Capital Protection Expert MT4 |Forex Money Management: Forex Trade Management Expert MT4 |ICT Concepts Indicator MT4 | Smart Money Concepts Expert MT4| Get a free Expert Advisor license via Telegram and WhatsApp
Why Combine Fibonacci and Candlestick Patterns?
While Fibonacci levels effectively identify potential zones of support, resistance, and price reversals, they appear as broad zones on a chart rather than a single, precise entry point. Furthermore, there's always a risk that the price could move past a Fibonacci zone to trigger stops before reversing.
By combining Fibonacci retracement with candlestick patterns, traders can:
- Confirm a high-probability trade entry point.
- Identify a suitable zone for placing stop-loss orders, thus improving risk management.
Suitable Candlestick Patterns for Fibonacci Combination
When combining Fibonacci with candlesticks, reversal candlestick patterns are most effective. This strategy is applicable for both trend-following and counter-trend trades.
Common reversal candlestick patterns suitable for this combination include:
- Hammer Pattern: This pattern features a long lower shadow and a short body at the top (ideally one-third the length of the shadow). It signals the potential end of a downtrend and the beginning of an uptrend.
- Shooting Star Pattern: Comprising a long upper shadow and a small body at the bottom (ideally one-third the length of the shadow), a shooting star signals a potential end to an uptrend and the start of a downtrend.
- Hanging Man Pattern: Characterized by a short body at the top and a long lower shadow, the Hanging Man typically indicates the end of an uptrend and a potential bearish reversal.
- Engulfing Pattern: This two-candlestick pattern occurs when the second candle fully engulfs the first candle in the opposite direction. It is a strong indicator of a potential trend reversal in both bullish and bearish markets.
A Practical Example: The Fibonacci and Candlestick Trading Strategy
To trade effectively using this combined strategy, follow these three key steps:
1. Drawing Fibonacci Levels
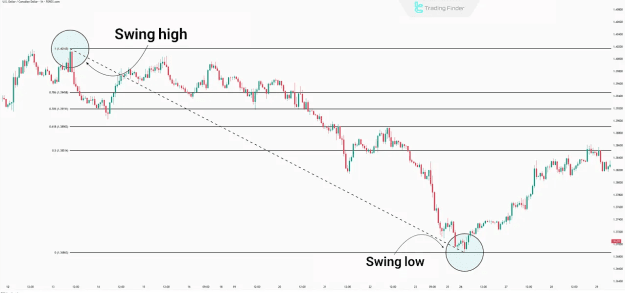
First, identify a clear price trend. Then, use the Fibonacci retracement tool to connect the swing high and swing low of that trend. This action will display the significant Fibonacci levels on your chart.
2. Price Reaching a Significant Fibonacci Level
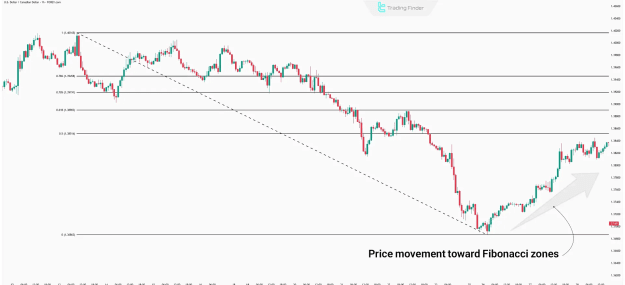
Next, wait for the price to retrace and approach one of the key Fibonacci levels. Reversals are most likely to occur at the 0.5, 0.618, and 0.786 levels. In a typical trading scenario, the price will find support or resistance at one of these levels before a potential reversal begins.
3. Formation of a Reversal Candlestick Pattern
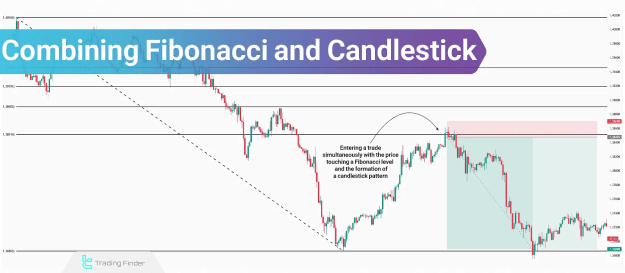
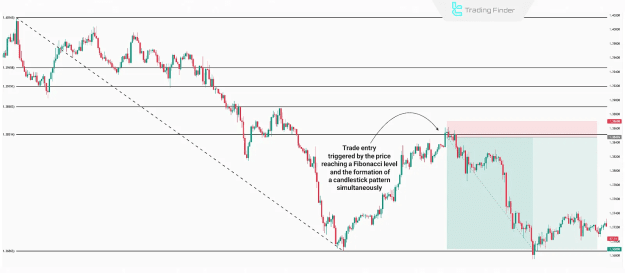
This final step involves confirming a trade entry by combining the Fibonacci tool with candlestick analysis. Once the price reaches a key Fibonacci level, wait for one of the reversal candlestick patterns to form. The formation of a pattern like a Hammer or an Engulfing pattern at a Fibonacci level provides a high-probability signal to enter a trade.
The Importance of Risk and Capital Management
It's crucial to remember that the formation of a reversal candlestick pattern at a Fibonacci level does not guarantee a price reversal. The market may continue its trend, and the price might break through one Fibonacci level only to reverse at the next.
Therefore, implementing robust risk and capital management is paramount with this strategy. By applying proper risk management, if a trade at the 0.5 Fibonacci level fails, you will have sufficient capital remaining to enter a new position if a valid reversal signal appears at the 0.618 level. This discipline is essential for long-term trading success.